
 資料結構
資料結構 網路
網路 RDBMS
RDBMS 作業系統
作業系統 Java
Java iOS
iOS HTML
HTML CSS
CSS Android
 Python
 C 程式
C 程式 C++
C++ C#
C# MongoDB
 MySQL
MySQL Javascript
 PHP
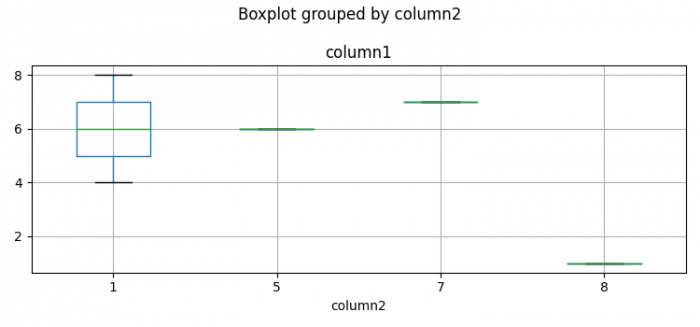
PHP用 Python Pandas 繪製分層箱線圖
要建立分層箱線圖,我們可以在 Python 類中執行以下步驟 -
步驟
設定圖形大小並調整子圖之間的內邊距和周圍的內邊距。
建立一個二維、大小可變、可能有異構表的 Pandas 資料框。
計算一組資料的直方圖。
建立一個按列分層的箱線圖。
要顯示圖形,請使用 **show()** 方法。
示例
import pandas as pd
import numpy as np
from matplotlib import pyplot as plt

# Set the figure size
plt.rcParams["figure.figsize"] = [7.50, 3.50]
plt.rcParams["figure.autolayout"] = True

# Pandas dataframe
df = pd.DataFrame({"column1": [4, 6, 7, 1, 8], "column2": [1, 5, 7, 8, 1]})

# Compute the histogram
_, breaks = np.histogram(df.column1, bins=5)

# Create the boxplot
ax = df.boxplot(column='column1', by='column2')

# Display the plot
plt.show()
輸出
它將產生以下輸出 -

更新於:02-02-2022
399 次瀏覽

廣告