
 資料結構
資料結構 網路
網路 關係資料庫管理系統 (RDBMS)
 作業系統
作業系統 Java
Java iOS
iOS HTML
HTML CSS
CSS Android
 Python
 C語言程式設計
 C++
C++ C#
C# MongoDB
 MySQL
MySQL Javascript
 PHP
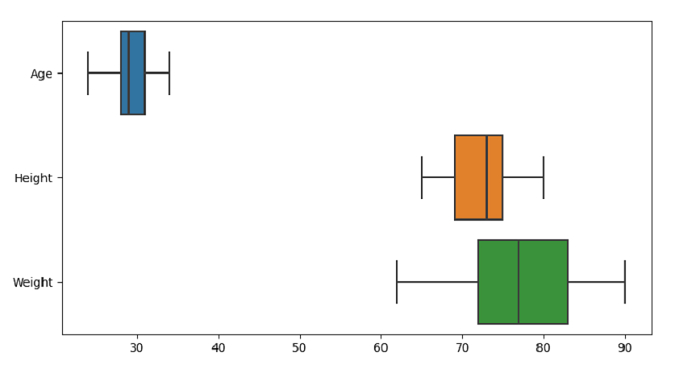
PHPPython Pandas - 使用Seaborn為DataFrame中的每個數值變數繪製箱線圖
Seaborn中的箱線圖用於繪製箱線圖,以顯示關於類別的分佈。 seaborn.boxplot() 用於此目的。“**orient**”引數用於設定每個數值變數的方向。
假設以下資料是CSV檔案形式的資料集:Cricketers.csv
首先,匯入所需的庫:
import seaborn as sb
import pandas as pd
import matplotlib.pyplot as plt
將資料從CSV檔案載入到Pandas DataFrame:
dataFrame = pd.read_csv("C:\Users\amit_\Desktop\Cricketers.csv")使用orient引數繪製箱線圖,以設定每個數值變數的方向:
sb.boxplot( data = dataFrame, orient="h")
示例
以下是程式碼:
import seaborn as sb
import pandas as pd
import matplotlib.pyplot as plt

# Load data from a CSV file into a Pandas DataFrame:
dataFrame = pd.read_csv("C:\Users\amit_\Desktop\Cricketers.csv")

# plotting box plot
# using the orient parameter for orientation of each numeric variable
sb.boxplot( data = dataFrame, orient="h")

# display
plt.show()
輸出
這將產生以下輸出:

更新於:2021年9月30日
2K+ 次瀏覽

廣告