- Angular Highcharts 教程
- Angular Highcharts - 主頁
- Angular Highcharts - 概覽
- 環境設定
- 配置語法
- Angular Highcharts - 折線圖
- Angular Highcharts - 面積圖
- Angular Highcharts - 條形圖
- Angular Highcharts - 柱狀圖
- Angular Highcharts - 餅圖
- Angular Highcharts - 散點圖
- Angular Highcharts - 動態圖
- Angular Highcharts - 組合圖
- Angular Highcharts - 3D 圖表
- Angular Highcharts - 地圖圖
- Angular Highcharts 資源
- Angular Highcharts - 快速指南
- Angular Highcharts - 資源
- Angular Highcharts - 討論
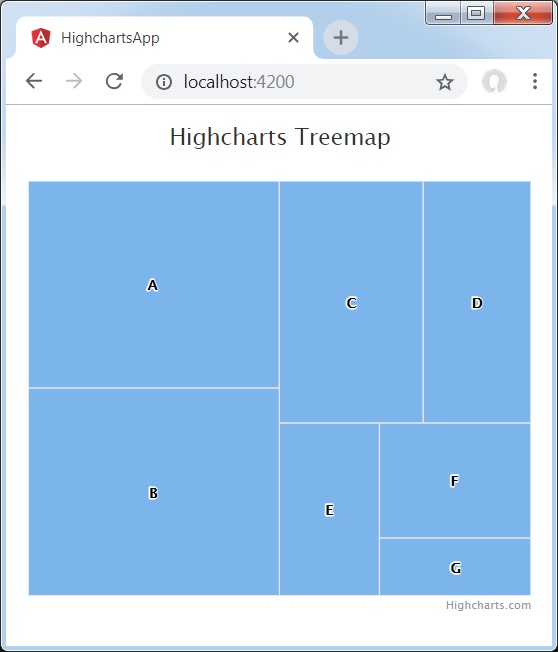
Angular Highcharts - 樹狀圖
以下是樹狀圖的一個示例。
我們已經在 Highcharts 配置語法 章節中看到了用於繪製圖表的配置。
下面是一個樹狀圖示例。
配置
現在讓我們看看採取的其他配置/步驟。
series
將圖表型別配置為基於“treemap”。**series.type** 決定了圖表系列的型別。在這裡,預設值是“line”。
series : [{type: "treemap"}]
示例
app.component.ts
import { Component } from '@angular/core';
import * as Highcharts from 'highcharts';
import * as highchartsTreemap from 'highcharts/modules/treemap';
highchartsTreemap(Highcharts);
@Component({
   selector: 'app-root',
   templateUrl: './app.component.html',
   styleUrls: ['./app.component.css']
})
export class AppComponent {
   highcharts = Highcharts;
   chartOptions = {
      title : {
         text: 'Highcharts Treemap'
      },
      colorAxis : {
         minColor: '#FFFFFF',
         maxColor: Highcharts.getOptions().colors[0]
      },
      series : [{
         type: "treemap",
         layoutAlgorithm: 'squarified',
         data: [
         {
            name: 'A',
            value: 6,
            colorValue: 1
         },
         {
            name: 'B',
            value: 6,
            colorValue: 2
         },
         {
            name: 'C',
            value: 4,
            colorValue: 3
         },
         {
            name: 'D',
            value: 3,
            colorValue: 4
         },
         {
            name: 'E',
            value: 2,
            colorValue: 5
         },
         {
            name: 'F',
            value: 2,
            colorValue: 6
         },
         {
            name: 'G',
            value: 1,
            colorValue: 7
         }
         ]
      }]
   };
}
結果
驗證結果。
angular_highcharts_map_charts.htm
廣告