- Angular Highcharts 教程
- Angular Highcharts - 主頁
- Angular Highcharts - 概覽
- 環境設定
- 配置語法
- Angular Highcharts - 折線圖
- Angular Highcharts - 曲線圖
- Angular Highcharts - 條形圖
- Angular Highcharts - 柱狀圖
- Angular Highcharts - 餅狀圖
- Angular Highcharts - 散點圖
- Angular Highcharts - 動態圖表
- Angular Highcharts - 組合圖
- Angular Highcharts - 3D 圖表
- Angular Highcharts - 地圖圖
- Angular Highcharts 資源
- Angular Highcharts - 快速指南
- Angular Highcharts - 資源
- Angular Highcharts - 討論
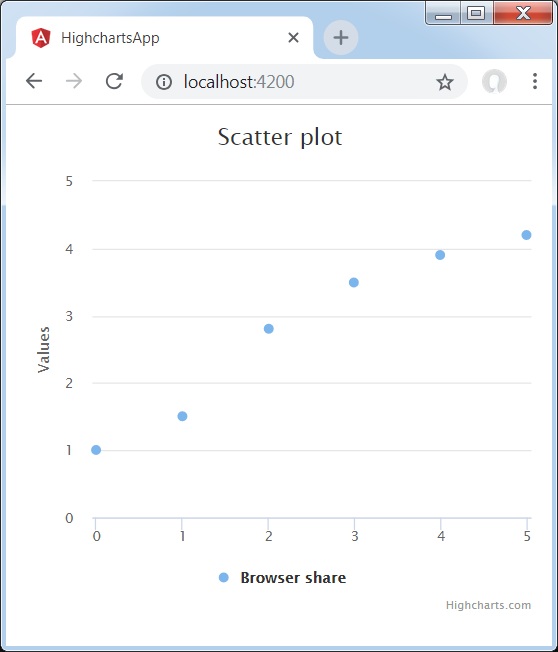
Angular Highcharts - 散點圖
下面是一個基礎散點圖的範例。
我們在 Highcharts 配置語法 章節中已經看到了用於繪製圖表的配置。
下面提供了一個基礎散點圖的範例。
配置
我們現在看看額外的配置/步驟。
系列
將圖表型別配置為基於散點。series.type 決定了圖表的系列型別。在此,預設值為“line”。
var chart = {
   type: 'scatter',
   zoomType: 'xy'
};
範例
app.component.ts
import { Component } from '@angular/core';
import * as Highcharts from 'highcharts';
@Component({
  selector: 'app-root',
  templateUrl: './app.component.html',
  styleUrls: ['./app.component.css']
})
export class AppComponent {
   highcharts = Highcharts;
   chartOptions = {
      title : {
         text: 'Scatter plot'
      },
      series : [{
         type: 'scatter',
         zoomType:'xy',
         name: 'Browser share',
         data: [ 1, 1.5, 2.8, 3.5, 3.9, 4.2 ]
      }]
   };
}
結果
驗證結果。
廣告