- Angular Highcharts 教程
- Angular Highcharts - 首頁
- Angular Highcharts - 概覽
- 環境設定
- 配置語法
- Angular Highcharts - 折線圖
- Angular Highcharts - 區域圖
- Angular Highcharts - 條形圖
- Angular Highcharts - 柱狀圖
- Angular Highcharts - 餅圖
- Angular Highcharts - 散點圖
- Angular Highcharts - 動態圖表
- Angular Highcharts - 組合
- Angular Highcharts - 3D 圖表
- Angular Highcharts - 地圖圖表
- Angular Highcharts 資源
- Angular Highcharts - 快速指南
- Angular Highcharts - 資源
- Angular Highcharts - 討論
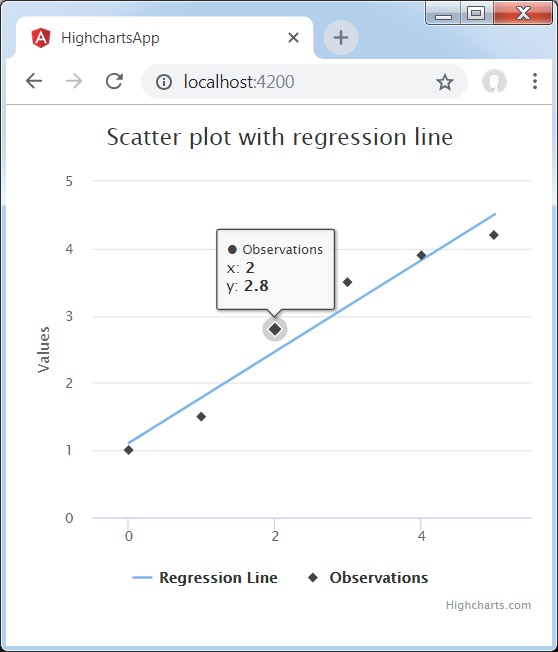
Angular Highcharts - 帶回歸線的散點圖
以下是一個帶回歸線的散點圖的示例。
我們已經看到用於在 Highcharts 配置語法 一章中繪製圖表的配置。
帶回歸線的散點圖的示例如下所示。
配置
現在讓我們來看看所採取的附加配置/步驟。
系列
將圖表型別配置為基於散點的圖表。系列型別決定圖表的系列型別。在此處,預設值為“折線”。
series : [{
   type: 'scatter'
}]
示例
app.component.ts
import { Component } from '@angular/core';
import * as Highcharts from 'highcharts';
@Component({
   selector: 'app-root',
   templateUrl: './app.component.html',
   styleUrls: ['./app.component.css']
})
export class AppComponent {
   highcharts = Highcharts;
   chartOptions = {
      title : {
         text: 'Scatter plot with regression line'
      },
      xAxis : {
         min: -0.5,
         max: 5.5
      },
      yAxis : {
         min: 0
      },
      series : [
      {
         type: 'line',
         name: 'Regression Line',
         data: [[0, 1.11], [5, 4.51]],
         marker: {
            enabled: false
         },
         states: {
            hover: {
               lineWidth: 0
            }
         },
         enableMouseTracking: false
      },
      {
         type: 'scatter',
         name: 'Observations',
         data: [1, 1.5, 2.8, 3.5, 3.9, 4.2],
         marker: {
            radius: 4
         }
      }]
   };
}
結果
驗證結果。
angular_highcharts_combinations.htm
廣告