- Angular Highcharts 教程
- Angular Highcharts - 主頁
- Angular Highcharts - 概覽
- 環境設定
- 配置語法
- Angular Highcharts - 折線圖
- Angular Highcharts - 區域圖
- Angular Highcharts - 條形圖
- Angular Highcharts - 柱狀圖
- Angular Highcharts - 餅圖
- Angular Highcharts - 散點圖
- Angular Highcharts - 動態圖表
- Angular Highcharts - 組合
- Angular Highcharts - 3D 圖表
- Angular Highcharts - 地圖圖表
- Angular Highcharts 資源
- Angular Highcharts - 快速指南
- Angular Highcharts - 資源
- Angular Highcharts - 討論
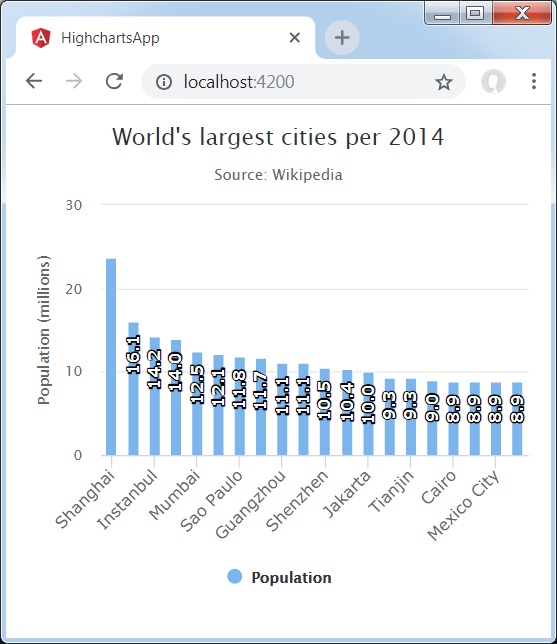
帶旋轉標籤的列
以下是一個具有旋轉標籤的柱狀圖示例。
我們已在 Highcharts 配置語法 章節中看到了用於繪製圖表時使用的配置。現在讓我們檢視其他配置,以及如何在 dataLabels 中新增 rotation 屬性。
以下是具有旋轉標籤的柱狀圖示例。
dataLabels
dataLabels 是圖表中處理資料標籤的包裝物件。
以角度表示的文字旋轉。注意,由於結構更復雜,旋轉的資料標籤上的背景、邊框和填充將丟失。此項的預設值為 0。
dataLabels = {
   enabled: true,
   rotation: -90,
   color: '#FFFFFF',
   align: 'right',
   format: '{point.y:.1f}', // one decimal
   y: 10, // 10 pixels down from the top
   style: {
      fontSize: '13px',
      fontFamily: 'Verdana, sans-serif'
   }
}
示例
app.component.ts
import { Component } from '@angular/core';
import * as Highcharts from 'highcharts';
@Component({
   selector: 'app-root',
   templateUrl: './app.component.html',
   styleUrls: ['./app.component.css']
})
export class AppComponent {
   highcharts = Highcharts;
   chartOptions = {
      chart : {
         type: 'column'
      },
      title : {
         text: 'World\'s largest cities per 2014'
      },
      subtitle: {
         text: 'Source: <a href = "http://en.wikipedia.org/wiki/List_of_cities_proper_by_population">Wikipedia</a>'
      },
      xAxis : {
         type: 'category',
         labels: {
            rotation: -45,
            style: {
               fontSize: '13px',
               fontFamily: 'Verdana, sans-serif'
            }
         }
      },
      yAxis : {
         min: 0,
         title: {
            text: 'Population (millions)'
         }
      },
      tooltip : {
         pointFormat: 'Population in 2008: <b>{point.y:.1f} millions</b>'
      },
      credits : {
         enabled: false
      },
      series : [
         {
            name: 'Population',
            data: [
               ['Shanghai', 23.7],
               ['Lagos', 16.1],
               ['Instanbul', 14.2],
               ['Karachi', 14.0],
               ['Mumbai', 12.5],
               ['Moscow', 12.1],
               ['Sao Paulo', 11.8],
               ['Beijing', 11.7],
               ['Guangzhou', 11.1],
               ['Delhi', 11.1],
               ['Shenzhen', 10.5],
               ['Seoul', 10.4],
               ['Jakarta', 10.0],
               ['Kinshasa', 9.3],
               ['Tianjin', 9.3],
               ['Tokyo', 9.0],
               ['Cairo', 8.9],
               ['Dhaka', 8.9],
               ['Mexico City', 8.9],
               ['Lima', 8.9]
            ],
            dataLabels: {
               enabled: true,
               rotation: -90,
               color: '#FFFFFF',
               align: 'right',
               format: '{point.y:.1f}', // one decimal
               y: 10, // 10 pixels down from the top
               style: {
                  fontSize: '13px',
                  fontFamily: 'Verdana, sans-serif'
               }
            }
         }
      ]
   };
}
結果
驗證結果。
angular_highcharts_column_charts.htm
廣告