- Angular Highcharts 教程
- Angular Highcharts - 首頁
- Angular Highcharts - 概覽
- 環境設定
- 配置語法
- Angular Highcharts - 折線圖
- Angular Highcharts - 面積圖
- Angular Highcharts - 條形圖
- Angular Highcharts - 柱狀圖
- Angular Highcharts - 餅狀圖
- Angular Highcharts - 散點圖
- Angular Highcharts - 動態圖表
- Angular Highcharts - 組合圖
- Angular Highcharts - 3D 圖表
- Angular Highcharts - 地圖圖表
- Angular Highcharts 資源
- Angular Highcharts - 快速指南
- Angular Highcharts - 資源
- Angular Highcharts - 討論
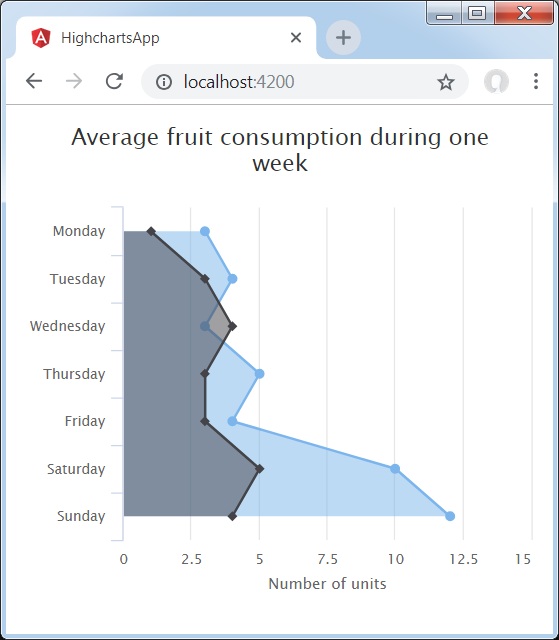
反轉值的面積圖
以下是一個反轉值面積圖示例。
我們已在 Highcharts 配置語法 一章中瞭解了用於繪製圖表所用配置。現在,讓我們看一個帶有反轉座標軸的面積圖示例。我們還將瞭解其他配置,並在圖表中新增反轉屬性。
圖表
將圖表的反轉配置為 true。
將座標軸配置為反轉。當為 true 時,x 軸為垂直的,而 y 軸為水平的。如果圖表中存在條形圖序列,則該序列也會反轉。此處的預設值為 false。
var chart = {
   type: 'area',
   inverted: true
};
示例
app.component.ts
import { Component } from '@angular/core';
import * as Highcharts from 'highcharts';
@Component({
   selector: 'app-root',
   templateUrl: './app.component.html',
   styleUrls: ['./app.component.css']
})
export class AppComponent {
   highcharts = Highcharts;
   chartOptions = {
      chart: {
        type: 'area',
        inverted: true
      },
      title: {
        text: 'Average fruit consumption during one week'
      },
      subtitle : {
         style: {
            position: 'absolute',
            right: '0px',
            bottom: '10px'
         }
      },
      legend : {
         layout: 'vertical',
         align: 'left',
         verticalAlign: 'top',
         x: -150,
         y: 100,
         floating: true,
         borderWidth: 1,
         backgroundColor: (
            Highcharts.theme && Highcharts.theme.legendBackgroundColor) ||
               '#FFFFFF'
      },
      xAxis:{
         categories: ['Monday','Tuesday','Wednesday','Thursday',
            'Friday','Saturday','Sunday']
      },
      yAxis : {
         title: {
            text: 'Number of units'
         },
         labels: {
            formatter: function () {
               return this.value;
            }
         },
         min:0
      },
      tooltip : {
         formatter: function () {
            return '<b>' + this.series.name + '</b><br/>' +
               this.x + ': ' + this.y;
         }
      },
      plotOptions : {
         area: {
            fillOpacity: 0.5
         }
      },
      credits:{
         enabled: false
      },
      series: [
         {
            name: 'John',
            data: [3, 4, 3, 5, 4, 10, 12]
         },
         {
            name: 'Jane',
            data: [1, 3, 4, 3, 3, 5, 4]
         }
      ]
   };
}
結果
驗證結果。
angular_highcharts_area_charts.htm
廣告