使用 ELK 和 Sleuth 進行分散式日誌記錄
簡介
在分散式環境或單體環境中,應用程式日誌對於除錯任何錯誤都至關重要。在本節中,我們將探討如何有效地記錄日誌並改進跟蹤能力,以便我們能夠輕鬆檢視日誌。
日誌模式對日誌記錄至關重要的兩個主要原因:
服務間呼叫 - 在微服務架構中,服務之間存在非同步和同步呼叫。連結這些請求至關重要,因為單個請求可能存在多級巢狀。
服務內呼叫 - 單個服務接收多個請求,它們的日誌很容易混雜在一起。因此,為請求關聯一些 ID 對於過濾請求的所有日誌變得很重要。
Sleuth 是一個用於應用程式日誌記錄的知名工具,而 ELK 用於更簡單的系統級觀測。
依賴設定
讓我們使用我們在每一章中都用到的餐廳案例。假設我們有客戶服務和餐廳服務透過 API(即同步通訊)進行通訊。我們希望使用 Sleuth 來跟蹤請求,並使用 ELK 堆疊進行集中視覺化。
為此,首先設定 ELK 堆疊。為此,我們將使用 Docker 容器啟動 ELK 堆疊。以下是我們可以考慮的映象:
完成 ELK 設定後,透過訪問以下 API 來確保其按預期工作:
Elasticsearch − localhost:9200
Kibana − localhost:5601
我們將在本節末尾檢視 Logstash 配置檔案。
然後,讓我們將以下依賴項新增到我們的客戶服務和餐廳服務:
<dependency>
      <groupId>org.springframework.cloud</groupId>
      <artifactId>spring-cloud-starter-sleuth</artifactId>
</dependency>
現在我們已經設定了依賴項並運行了 ELK,讓我們轉到核心示例。
服務內部的請求跟蹤
在最基本的層面上,Sleuth 添加了以下元資料:
服務名稱 - 當前正在處理請求的服務。
跟蹤 ID - 將一個元資料 ID 新增到日誌中,該 ID 會在服務之間傳送以處理輸入請求。這對於服務間通訊非常有用,用於對處理一個輸入請求的所有內部請求進行分組。
跨度 ID - 將一個元資料 ID 新增到日誌中,該 ID 在服務為處理請求而記錄的所有日誌語句中都是相同的。它對服務內日誌很有用。請注意,對於父服務,跨度 ID = 跟蹤 ID。
讓我們看看它的實際效果。為此,讓我們更新我們的客戶服務程式碼以包含日誌行。以下是我們將使用的控制器程式碼。
package com.tutorialspoint;
import java.util.HashMap;
import org.slf4j.Logger;
import org.slf4j.LoggerFactory;
import org.springframework.beans.factory.annotation.Autowired;
import org.springframework.messaging.Message;
import org.springframework.web.bind.annotation.PathVariable;
import org.springframework.web.bind.annotation.RequestMapping;
import org.springframework.web.bind.annotation.RequestMethod;
import org.springframework.web.bind.annotation.RestController;
@RestController
class RestaurantCustomerInstancesController {
   Logger logger =
LoggerFactory.getLogger(RestaurantCustomerInstancesController.class);
   static HashMap<Long, Customer> mockCustomerData = new HashMap();
   static{
      mockCustomerData.put(1L, new Customer(1, "Jane", "DC"));
      mockCustomerData.put(2L, new Customer(2, "John", "SFO"));
      mockCustomerData.put(3L, new Customer(3, "Kate", "NY"));
   }
   @RequestMapping("/customer/{id}")
   public Customer getCustomerInfo(@PathVariable("id") Long id) {
      logger.info("Querying customer with id: " + id);
      Customer customer = mockCustomerData.get(id);
      if(customer != null) {
         logger.info("Found Customer: " + customer);
      }
      return customer;
   }
}
現在讓我們執行程式碼,像往常一樣,啟動 Eureka 伺服器。請注意,這不是硬性要求,這裡是為了完整性。
然後,讓我們使用以下命令編譯並啟動更新後的客戶服務:
mvn clean install ; java -Dapp_port=8083 -jar .\target\spring-cloud-eurekaclient-
1.0.jar
我們準備好了,現在讓我們透過訪問 API 來測試我們的程式碼片段:
curl -X GET https://:8083/customer/1
以下是我們將為此 API 獲取的輸出:
{
   "id": 1,
   "name": "Jane",
   "city": "DC"
}
現在讓我們檢查客戶服務的日誌:
2021-03-23 13:46:59.604 INFO [customerservice,
b63d4d0c733cc675,b63d4d0c733cc675] 11860 --- [nio-8083-exec-7]
.t.RestaurantCustomerInstancesController : Querying customer with id: 1
2021-03-23 13:46:59.605 INFO [customerservice,
b63d4d0c733cc675,b63d4d0c733cc675] 11860 --- [nio-8083-exec-7]
.t.RestaurantCustomerInstancesController : Found Customer: Customer [id=1,
name=Jane, city=DC]
…..
因此,有效地,正如我們所看到的,我們在日誌語句中添加了服務名稱、跟蹤 ID 和跨度 ID。
跨服務的請求跟蹤
讓我們看看如何跨服務進行日誌記錄和跟蹤。例如,我們將使用內部呼叫客戶服務的餐廳服務。
為此,讓我們更新我們的餐廳服務程式碼以包含日誌行。以下是我們將使用的控制器程式碼。
package com.tutorialspoint;
import java.util.HashMap;
import java.util.List;
import java.util.function.Consumer;
import java.util.function.Supplier;
import java.util.stream.Collectors;
import org.slf4j.Logger;
import org.slf4j.LoggerFactory;
import org.springframework.beans.factory.annotation.Autowired;
import org.springframework.context.annotation.Bean;
import org.springframework.web.bind.annotation.PathVariable;
import org.springframework.web.bind.annotation.RequestMapping;
import org.springframework.web.bind.annotation.RestController;
@RestController
class RestaurantController {
   @Autowired
   CustomerService customerService;
   Logger logger = LoggerFactory.getLogger(RestaurantController.class);
   static HashMap<Long, Restaurant> mockRestaurantData = new HashMap();
   static{
      mockRestaurantData.put(1L, new Restaurant(1, "Pandas", "DC"));
      mockRestaurantData.put(2L, new Restaurant(2, "Indies", "SFO"));
      mockRestaurantData.put(3L, new Restaurant(3, "Little Italy", "DC"));
      mockRestaurantData.put(4L, new Restaurant(4, "Pizeeria", "NY"));
   }
   @RequestMapping("/restaurant/customer/{id}")
   public List<Restaurant> getRestaurantForCustomer(@PathVariable("id") Long id) {
      logger.info("Get Customer from Customer Service with customer id: " + id);
      Customer customer = customerService.getCustomerById(id);
      logger.info("Found following customer: " + customer);
      String customerCity = customer.getCity();
      return mockRestaurantData.entrySet().stream().filter(
      entry -> entry.getValue().getCity().equals(customerCity))
      .map(entry -> entry.getValue())
      .collect(Collectors.toList());
   }
}
讓我們使用以下命令編譯並啟動更新後的餐廳服務:
mvn clean install; java -Dapp_port=8082 -jar .\target\spring-cloud-feign-client-1.0.jar
確保我們已執行 Eureka 伺服器和客戶服務。我們準備好了,現在讓我們透過訪問 API 來測試我們的程式碼片段:
curl -X GET https://:8082/restaurant/customer/2
以下是我們將為此 API 獲取的輸出:
[
   {
      "id": 2,
      "name": "Indies",
      "city": "SFO"
   }
]
現在,讓我們檢查餐廳服務的日誌:
2021-03-23 14:44:29.381 INFO [restaurantservice,
6e0c5b2a4fc533f8,6e0c5b2a4fc533f8] 19600 --- [nio-8082-exec-6]
com.tutorialspoint.RestaurantController : Get Customer from Customer Service
with customer id: 2
2021-03-23 14:44:29.400 INFO [restaurantservice,
6e0c5b2a4fc533f8,6e0c5b2a4fc533f8] 19600 --- [nio-8082-exec-6]
com.tutorialspoint.RestaurantController : Found following customer: Customer
[id=2, name=John, city=SFO]
然後,讓我們檢查客戶服務的日誌:
2021-03-23 14:44:29.392 INFO [customerservice,
6e0c5b2a4fc533f8,f2806826ac76d816] 11860 --- [io-8083-exec-10]
.t.RestaurantCustomerInstancesController : Querying customer with id: 2
2021-03-23 14:44:29.392 INFO [customerservice,
6e0c5b2a4fc533f8,f2806826ac76d816] 11860 --- [io-8083-exec-10]
.t.RestaurantCustomerInstancesController : Found Customer: Customer [id=2,
name=John, city=SFO]…..
因此,有效地,正如我們所看到的,我們在日誌語句中添加了服務名稱、跟蹤 ID 和跨度 ID。此外,我們看到跟蹤 ID,即 6e0c5b2a4fc533f8 在客戶服務和餐廳服務中重複出現。
使用 ELK 進行集中式日誌記錄
到目前為止,我們看到的是透過 Sleuth 來改進我們的日誌記錄和跟蹤能力的一種方法。但是,在微服務架構中,我們有多個服務執行,並且每個服務有多個例項執行。檢視每個例項的日誌以識別請求流是不切實際的。這就是 ELK 對我們有幫助的地方。
讓我們使用與 Sleuth 相同的服務間通訊案例。讓我們更新我們的餐廳和客戶服務以新增logback 附加器用於 ELK 堆疊。
在繼續之前,請確保已設定 ELK 堆疊並且可以在 localhost:5601 訪問 Kibana。此外,請使用以下設定配置 Lostash 配置:
input {
   tcp {
      port => 8089
      codec => json
   }
}
output {
   elasticsearch {
      index => "restaurant"
      hosts => ["https://:9200"]
   }
}
完成此操作後,我們需要執行兩個步驟才能在我們的 Spring 應用程式中使用 Logstash。我們將為我們的兩個服務執行以下步驟。首先,新增 logback 的依賴項以使用 Logstash 的附加器。
<dependency>
<groupId>net.logstash.logback</groupId>
   <artifactId>logstash-logback-encoder</artifactId>
   <version>6.6</version>
</dependency>
其次,為 logback 新增一個附加器,以便 logback 可以使用此附加器將資料傳送到 Logstash
<?xml version="1.0" encoding="UTF-8"?>
<configuration>
   <appender name="logStash"
class="net.logstash.logback.appender.LogstashTcpSocketAppender">
      <destination>10.24.220.239:8089</destination>
      <encoder class="net.logstash.logback.encoder.LogstashEncoder" />
   </appender>
   <appender name="console" class="ch.qos.logback.core.ConsoleAppender">
      <encoder>
         <pattern>%d{HH:mm:ss.SSS} [%thread] %-5level %logger{36} -
%msg%n</pattern>
      </encoder>
   </appender>
   <root level="INFO">
      <appender-ref ref="logStash" />
      <appender-ref ref="console" />
   </root>
</configuration>
上面的附加器將記錄到控制檯,並將日誌傳送到 Logstash。現在,完成此操作後,我們就可以測試了。
現在,讓我們像往常一樣執行上述程式碼,啟動 Eureka 伺服器。
然後,讓我們使用以下命令編譯並啟動更新後的客戶服務:
mvn clean install ; java -Dapp_port=8083 -jar .\target\spring-cloud-eurekaclient- 1.0.jar
然後,讓我們使用以下命令編譯並啟動更新後的餐廳服務:
mvn clean install; java -Dapp_port=8082 -jar .\target\spring-cloud-feign-client- 1.0.jar
我們準備好了,現在讓我們透過訪問 API 來測試我們的程式碼片段:
curl -X GET https://:8082/restaurant/customer/2
以下是我們將為此 API 獲取的輸出:
[
   {
      "id": 2,
      "name": "Indies",
      "city": "SFO"
   }
]
但更重要的是,日誌語句也將顯示在 Kibana 上。
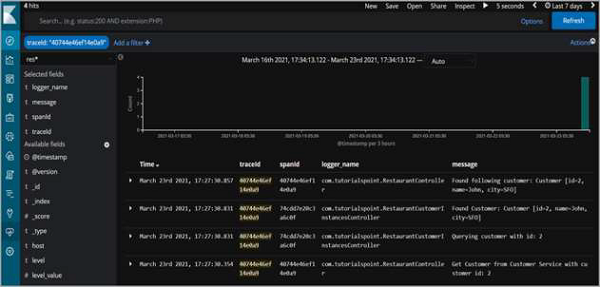
因此,正如我們所看到的,我們可以按跟蹤 ID進行篩選,並檢視跨服務記錄的所有日誌語句,這些語句是為了完成請求而記錄的。