
 資料結構
資料結構 網路
網路 RDBMS
RDBMS 作業系統
作業系統 Java
Java iOS
iOS HTML
HTML CSS
CSS Android
 Python
 C 程式設計
 C++
C++ C#
C# MongoDB
 MySQL
MySQL Javascript
 PHP
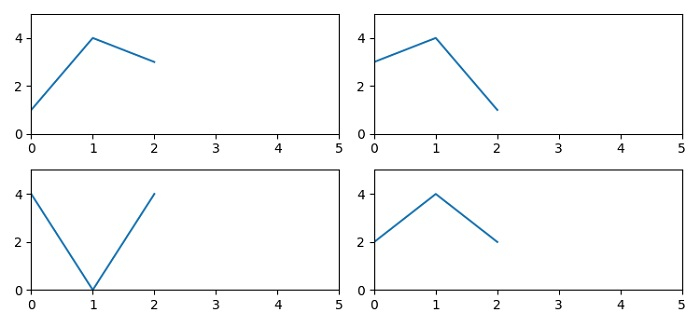
PHP設定 Matplotlib 中所有子圖的相同軸界限
要為 matplotlib 中的所有子圖設定相同的軸界限,我們可以使用 subplot() 方法,該方法可以建立 4 個子圖,其中 nrows=2,ncols=2,具有 x 和 y 軸共享。
步驟
設定圖形大小並調整子圖之間和周圍的填充。
將子圖新增到索引為 1 的當前圖形。
使用 set_xlim() 和 set_ylim() 方法設定x 和 y 軸檢視界限。
在軸 1(步驟 2)上繪製一條線。
將子圖新增到索引為 2(與步驟 3 相同界限)的當前圖形。
在軸 2 上繪製一條線。
將子圖新增到索引為 3(與步驟 3 相同界限)的當前圖形。
在軸 3 上繪製一條線。
將子圖新增到索引為 4(與步驟 3 相同界限)的當前圖形。
在軸 4 上繪製一條線。
要顯示圖形,請使用 show() 方法。
示例
from matplotlib import pyplot as plt
plt.rcParams["figure.figsize"] = [7.50, 3.50]
plt.rcParams["figure.autolayout"] = True
ax1 = plt.subplot(2, 2, 1)
ax1.set_xlim(left=0, right=5)
ax1.set_ylim(bottom=0, top=5)
ax1.plot([1, 4, 3])
ax2 = plt.subplot(2, 2, 2, sharey=ax1, sharex=ax1)
ax2.plot([3, 4, 1])
ax3 = plt.subplot(2, 2, 4, sharey=ax1, sharex=ax1)
ax3.plot([2, 4, 2])
ax4 = plt.subplot(2, 2, 3, sharey=ax1, sharex=ax1)
ax4.plot([4, 0, 4])
plt.show()
輸出

更新於:01-Jun-2021
15K+ 瀏覽量

廣告