
 資料結構
資料結構 網路
網路 RDBMS
RDBMS 作業系統
作業系統 Java
Java iOS
iOS HTML
HTML CSS
CSS Android
 Python
 C 程式設計
 C++
C++ C#
C# MongoDB
 MySQL
MySQL Javascript
 PHP
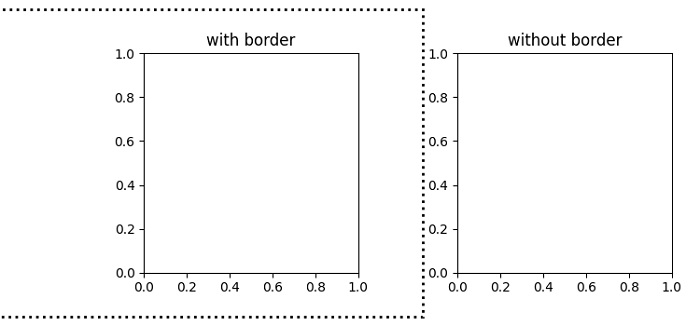
PHP用 Matplotlib 繪製子圖的邊框
要繪製 Matplotlib 中子圖的邊框,我們可以對子圖使用矩形路徑。
步驟
設定圖形大小並調整子圖之間及周圍的邊距。
使用 subplot(121) 向當前人物新增子圖。
獲取子圖軸線。
新增一個矩形,該矩形經由錨點 *xy* 及其 *width* 和 *height* 定義。
基於軸線(步驟 4),向當前子圖新增矩形路徑。
設定繪圖員是否使用剪下。
使用 subplot(122) 向當前人物新增子圖。
設定當前子圖的標題。
要顯示人物,請使用 show() 方法。
示例
from matplotlib import pyplot as plt

plt.rcParams["figure.figsize"] = [7.50, 3.50]
plt.rcParams["figure.autolayout"] = True

sub = plt.subplot(121)
ax = sub.axis()
rec = plt.Rectangle((ax[0] - 0.7, ax[2] - 0.2), (ax[1] - ax[0]) + 1, (ax[3] - ax[2]) + 0.4, fill=False, lw=2, linestyle="dotted")

rec = sub.add_patch(rec)

rec.set_clip_on(False)
plt.title("with border")

sub = plt.subplot(122)
plt.title("without border")

plt.show()
輸出

更新日期:03-Jun-2021
5K+ 瀏覽

廣告