
 資料結構
資料結構 網路
網路 RDBMS
RDBMS 作業系統
作業系統 Java
Java iOS
iOS HTML
HTML CSS
CSS 安卓
安卓 Python
 C 程式設計
 C++
C++ C#
C# MongoDB
 MySQL
MySQL Javascript
 PHP
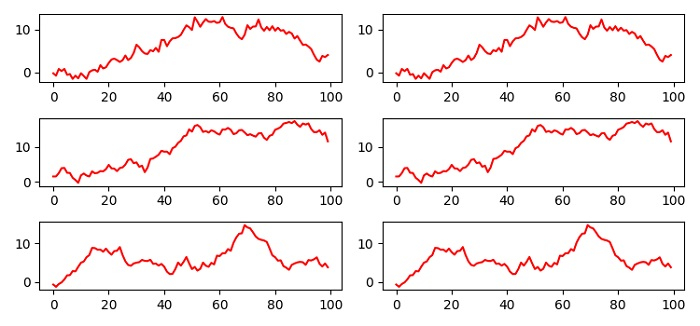
PHP透過迴圈和函式填充 Matplotlib 子圖
為了透過迴圈和函式填充 Matplotlib 子圖,我們可以採取以下步驟 −
設定圖形大小並調整子圖之間和周圍的填充。
用 3 行和 2 列建立圖形和一組子圖。
製作一個函式來迭代每行的列,並在每個列索引處使用 plot() 方法繪製 x 資料點。
迭代行(步驟 2)並建立隨機 x 資料點,然後呼叫 iterate_columns() 函式(步驟 3)。
要顯示圖形,請使用 show() 方法。
示例
import numpy as np
import matplotlib.pyplot as plt

plt.rcParams["figure.figsize"] = [7.50, 3.50]
plt.rcParams["figure.autolayout"] = True

fig, axes = plt.subplots(3, 2)

""" Iterate column's axes"""
def iterate_columns(cols, x):
   for col in cols:
      col.plot(x, color='red')

""" Iterate row's axes"""
for row in axes:
   x = np.random.normal(0, 1, 100).cumsum()
   iterate_columns(row, x)

plt.show()
輸出

更新於: 03-Jun-2021
5 千+ 瀏覽

廣告