
 資料結構
資料結構 網路
網路 關係型資料庫管理系統
 作業系統
作業系統 Java
Java iOS
iOS HTML
HTML CSS
CSS Android
 Python
 C 程式設計
 C++
C++ C#
C# MongoDB
 MySQL
MySQL Javascript
 PHP
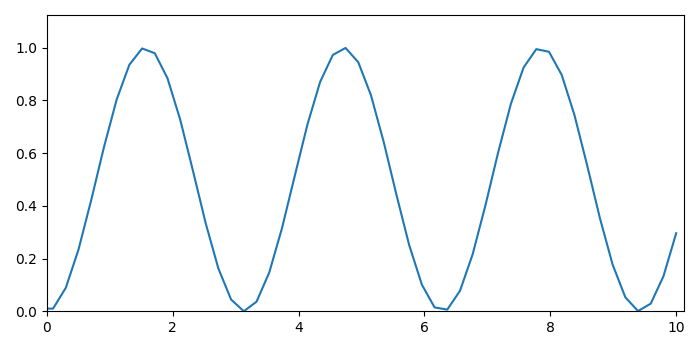
PHP在 matplotlib 中設定軸限制時保留內邊距
要保留內邊距同時設定軸限制,我們可以避免使用緊湊佈局,即 plt.rcParams["figure.autolayout"] = False。
步驟
設定影像大小並調整子圖之間的內邊距。
使用 numpy 建立 x 和 y 資料點。
使用 plot() 方法繪製 x 和 y 資料點。
設定 x 和 y 軸限制。
使用 Show() 方法顯示影像。
示例
import numpy as np
import matplotlib.pyplot as plt

plt.rcParams["figure.figsize"] = [7.00, 3.50]
plt.rcParams["figure.autolayout"] = True

x = np.linspace(-10, 10, 100)
y = np.sin(x) ** 2

plt.plot(x, y)

plt.xlim([0, max(x)+0.125])
plt.ylim([0, max(y)+0.125])

plt.show()
輸出
它將產生以下輸出 -

更新於: 2021-10-08
486 次瀏覽

廣告