
 資料結構
資料結構 網路
網路 RDBMS
RDBMS 作業系統
作業系統 Java
Java iOS
iOS HTML
HTML CSS
CSS 安卓
安卓 Python
 C程式設計
C程式設計 C++
C++ C#
C# MongoDB
 MySQL
MySQL Javascript
 PHP
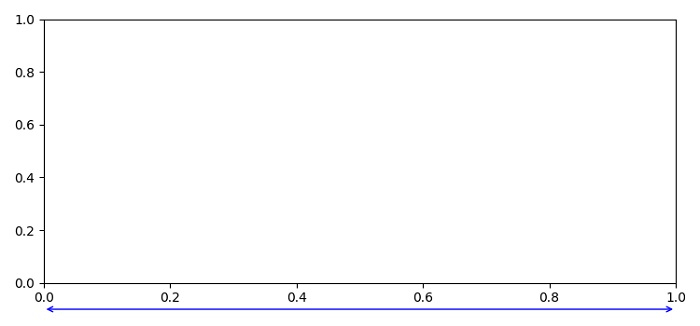
PHP如何繪製超出matplotlib中軸範圍的線?
要繪製超出軸範圍的線(即箭頭),可以使用annotate()方法,
步驟
設定圖形大小並調整子圖之間的填充和周圍的填充。
使用figure()方法建立一個新圖或啟用現有圖。
清除當前圖。
使用add_subplot()方法將'~.axes.Axes'作為子圖排列的一部分新增到圖中。
使用annotate()方法放置軸外的線。
要顯示圖形,請使用show()方法。
示例
import matplotlib.pyplot as plt

plt.rcParams["figure.figsize"] = [7.50, 3.50]
plt.rcParams["figure.autolayout"] = True

fig = plt.figure(1)
fig.clf()

ax = fig.add_subplot(1, 1, 1)
ax.annotate('', xy=(0, -0.1), xycoords='axes fraction', xytext=(1, -0.1),
arrowprops=dict(arrowstyle="<->", color='b'))
plt.show()
輸出

更新於:04-6月-2021
超過 2 千次檢視

廣告