
 資料結構
資料結構 網路
網路 RDBMS
RDBMS 作業系統
作業系統 Java
Java iOS
iOS HTML
HTML CSS
CSS Android
 Python
 C 程式設計
 C++
C++ C#
C# MongoDB
 MySQL
MySQL Javascript
 PHP
PHP子圖中的 Python xticks
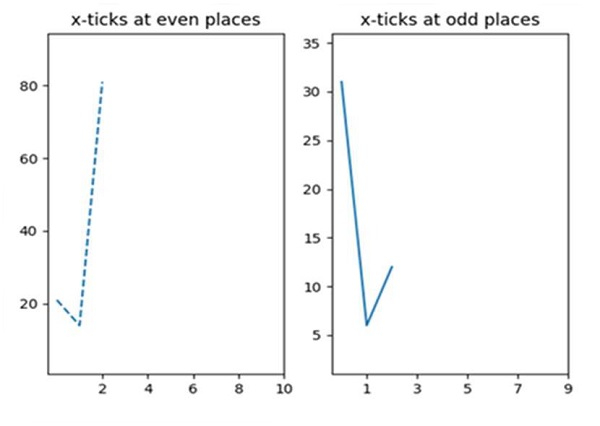
子圖可以將影像分割為 nrow*ncols 部分,並且 plt.xticks 有助於繪製子圖的 xticks。
步驟
為第 1 行和第 2 行建立兩個列表。
向當前影像新增子圖,nrow = 1,ncols = 2,index = 1。
以虛線形式繪製第 1 行。
設定或檢索自動縮放邊距 (0.2)。
將 xticks 放置在偶數位置。
設定 X 軸的標題。
向當前影像新增子圖,nrow = 1,ncols = 2 且 index = 2。
繪製第 2 行。
設定或檢索自動縮放邊距 (0.2)。
將 xticks 放置在奇數位置。
設定 X 軸的標題。
要顯示影像,請使用 plt.show() 方法。
示例
import matplotlib.pyplot as plt

line1 = [21, 14, 81]
line2 = [31, 6, 12]

plt.subplot(121)
plt.plot(line1, linestyle='dashed')
plt.margins(0.2)
plt.xticks([2, 4, 6, 8, 10])
plt.title("x-ticks at even places")

plt.subplot(122)
plt.plot(line2)
plt.margins(0.2)
plt.xticks([1, 3, 5, 7, 9])
plt.title("x-ticks at odd places")

plt.show()
輸出

更新於: 16-Mar-2021
5K+ 次檢視

廣告