
 資料結構
資料結構 網路
網路 關係資料庫管理系統 (RDBMS)
 作業系統
作業系統 Java
Java iOS
iOS HTML
HTML CSS
CSS Android
 Python
 C 程式設計
 C++
C++ C#
C# MongoDB
 MySQL
MySQL Javascript
 PHP
PHP在 Matplotlib 子圖中行和列標題
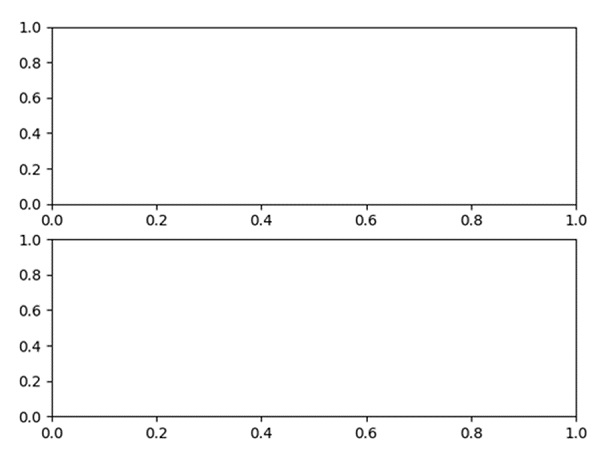
使用子圖方法,我們可以配置行數和列數。nrows*nclos 將建立繪製圖表的位置數。
步驟
行數 = 2,列數 = 1,因此總位置數為:2*1 = 2。
向當前圖形中新增子圖,nrow = 2,列 = 1,索引 = 1。
向當前圖形中新增子圖,nrow = 2,列 = 1,索引 = 2。
使用 plt.show(),我們可以顯示圖形。
示例
from matplotlib import pyplot as plt

row_count = 2
col_count = 1
index1 = 1

# no. of subplots are: row*col, index is the position of figure.

plt.subplot(row_count, col_count, index1)

index2 = 2
plt.subplot(row_count, col_count, index2)

plt.show()
輸出

更新日期:2021-03-16
436 次瀏覽

廣告