
 資料結構
資料結構 網路
網路 關係型資料庫管理系統
 作業系統
作業系統 Java
Java iOS
iOS HTML
HTML CSS
CSS Android
 Python
 C 程式設計
 C++
C++ C#
C# MongoDB
 MySQL
MySQL Javascript
 PHP
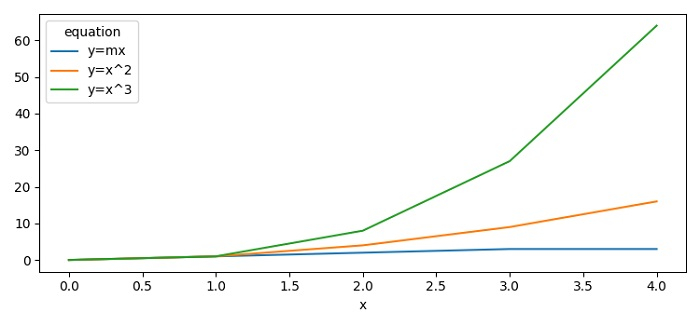
PHP使用 Pandas 和 Matplotlib 繪製多條折線圖
若要使用 Pandas 和 Matplotlib 繪製多條折線圖,我們可以按以下步驟操作 −
設定圖形大小,並調整子圖之間和周圍的內邊距。
使用 Pandas DataFrame 類建立一個 2D 可能非齊次表格資料,其中列為 x、y 和 方程式。
獲取按給定的索引(如 x、方程式和 y)重新整形的資料框。
使用 plot() 方法繪製線條。
要顯示圖形,請使用 show() 方法。
示例
import pandas as pd
from matplotlib import pyplot as plt
plt.rcParams["figure.figsize"] = [7.50, 3.50]
plt.rcParams["figure.autolayout"] = True
df = pd.DataFrame([
   ["y=x^3", 0, 0],
   ["y=x^3", 1, 1],
   ["y=x^3", 2, 8],
   ["y=x^3", 3, 27],
   ["y=x^3", 4, 64],
   ["y=x^2", 0, 0],
   ["y=x^2", 1, 1],
   ["y=x^2", 2, 4],
   ["y=x^2", 3, 9],
   ["y=x^2", 4, 16],
   ["y=mx", 0, 0],
   ["y=mx", 1, 1],
   ["y=mx", 2, 2],
   ["y=mx", 3, 3],
   ["y=mx", 4, 3],
], columns=['equation', 'x', 'y'])
df = df.pivot(index='x', columns='equation', values='y')
df.plot()
plt.show()
輸出

更新於: 01-6 月 -2021
4 千多個瀏覽量

廣告