
 資料結構
資料結構 網路
網路 RDBMS
RDBMS 作業系統
作業系統 Java
Java iOS
iOS HTML
HTML CSS
CSS Android
 Python
 C 程式設計
 C++
C++ C#
C# MongoDB
 MySQL
MySQL Javascript
 PHP
PHP使用 Pandas 功能繪製多個數據框
要使用 Pandas 功能繪製多個數據框,我們可以採取以下步驟 −
- 設定圖形大小並調整子圖形之間和周圍的邊距。
- 建立兩個 Pandas 資料框 df1 和 df2,由二維的、大小可變的、潛在異構的表格化資料組成。
- 使用 plot() 方法繪製 df1 和 df2。
- 要顯示圖形,請使用 show() 方法。
示例
import pandas as pd
from matplotlib import pyplot as plt
plt.rcParams["figure.figsize"] = [7.00, 3.50]
plt.rcParams["figure.autolayout"] = True
df1 = pd.DataFrame(
dict(
name=['John', 'James', 'Stephen', 'Kandy'],
age=[23, 45, 12, 34]
)
)
df2 = pd.DataFrame(
dict(
subject=['Math', 'Physics', 'Chemistry', 'Biology'],
marks=[67, 98, 90, 75]
)
)
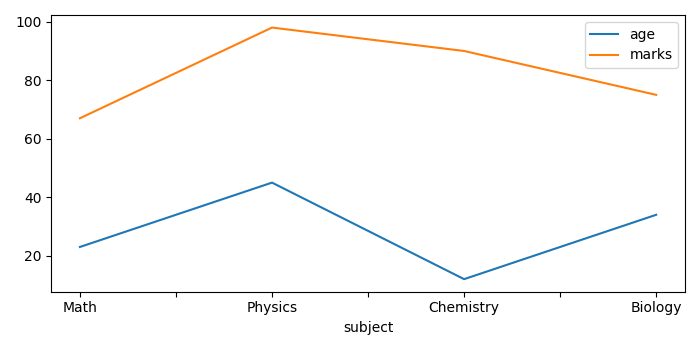
ax = df1.plot(x='name', y='age')
df2.plot(ax=ax, x='subject', y='marks')
plt.show()輸出
它將產生以下輸出


更新日期:22-9-2021
超過 24K 的瀏覽量

廣告