
 資料結構
資料結構 網路
網路 RDBMS
RDBMS 作業系統
作業系統 Java
Java iOS
iOS HTML
HTML CSS
CSS Android
 Python
 C 程式設計
 C++
C++ C#
C# MongoDB
 MySQL
MySQL Javascript
 PHP
PHP使用 Matplotlib 顯示條形圖
在本教程中,我們將使用 matplotlib 庫繪製條形圖。藉助 matplotlib 庫解決與 matplotlib 相關的問題時,最重要的步驟是匯入 matplotlib 庫。語法為:
import matplotlib.pyplot as plt
Pyplot 是一個命令風格的函式集合,它使 Matplotlib 能夠像 MATLAB 一樣工作
演算法
Step 1: Define a list of values.
Step 2: Use the bar() function in the matplotlib.pyplot library and define different parameters like height, width, etc.
Step 3: Label the axes using xlabel() and ylabel().
Step 3: Plot the graph using show().
示例程式碼
import matplotlib.pyplot as plt
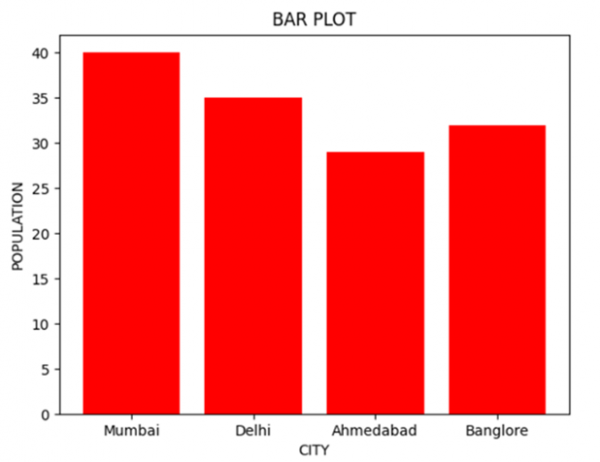
data_x = ['Mumbai', 'Delhi', 'Ahmedabad', 'Banglore']
data_y = [40, 35, 29, 32]
plt.xlabel("CITY")
plt.ylabel("POPULATION")
plt.title("BAR PLOT")
plt.bar(data_x, data_y, color='red')
plt.show()輸出

更新於:2021 年 3 月 16 日
234 次瀏覽

廣告