
 資料結構
資料結構 網路
網路 關係資料庫管理系統(RDBMS)
 作業系統
作業系統 Java
Java iOS
iOS HTML
HTML CSS
CSS Android
 Python
 C語言程式設計
 C++
C++ C#
C# MongoDB
 MySQL
MySQL Javascript
 PHP
PHP使用Matplotlib、NumPy和SciPy繪製方波
方波是一種非正弦波形,廣泛用於電氣和數位電路中表示訊號。基本上,這些電路使用方波來表示輸入和輸出或開和關。Python 提供了幾種繪製方波的方法,包括 Matplotlib、NumPy 和 SciPy 庫。這些庫提供了各種內建方法用於資料視覺化,方便建立和自定義方波圖。
繪製方波的Python程式
在討論示例程式之前,有必要熟悉 Matplotlib、NumPy 和 SciPy 庫的基礎知識。
Matplotlib
它是 Python 中最古老、最廣泛使用的繪相簿。它提供了一個低階介面,使我們可以完全控制圖形的各個方面,例如座標軸、標籤、圖例、顏色、標記等等。我們還可以將其與其他庫(如 NumPy 和 Pandas)整合,以繪製來自各種來源的資料。
NumPy
這是一個強大的 Python 庫,用於儲存和處理大型多維陣列。我們將在示例程式中使用此包為我們的方波生成隨機資料點。
SciPy
Python 的 SciPy 庫用於科學計算。它提供了一組內建模組,用於各種操作,例如訊號處理、積分、插值等等。我們將使用其名為“signal.square()”的內建方法來返回方波形。
示例1
下面的示例說明了如何使用 matplotlib、numpy 和 scipy 繪製帶有網格的方波。
方法
首先,匯入 numpy 庫,引用名稱為“np”,並從 matplotlib 庫匯入 pyplot 模組,將其重新命名為 plt。此外,從 scipy 匯入“signal”模組。
接下來,將頻率和幅度分別設定為 5 和 1。
使用內建方法“arange()”生成從 0 到 1 的值,步長為 0.001,並將它們儲存在 axisX 變數中。
計算週期,它等於頻率的倒數。
現在,呼叫 signal.square() 方法,該方法將 2π、頻率和 axisX 的乘積作為引數,以生成方波訊號。返回的波形將儲存在 axisY 變數中。
然後,使用 plot() 方法,以 axisX 和 axisY 為引數繪製方波。
藉助相應的內建方法,提供一些其他詳細資訊,例如 x 軸和 y 軸標籤、標題和網格線。
最後,使用“show()”方法顯示繪圖。
# importing required packages
import numpy as np
import matplotlib.pyplot as plt
from scipy import signal
# Setting frequency and amplitude for square wave
frequency = 5
amplitude = 1
# To generate values from 0 to 1 with a step size of 0.001
axisX = np.arange(0, 1, 0.001)
# Generating square wave signal using frequency and amplitude
period = 1.0 / frequency
axisY = amplitude * signal.square(2 * np.pi * frequency * axisX)
# Plotting the square wave with title and labels
plt.plot(axisX, axisY)
plt.xlabel('Time')
plt.ylabel('Amplitude')
plt.title('Square Wave Graph')
plt.grid(True)
# to display the final graph
plt.show()
輸出

示例2
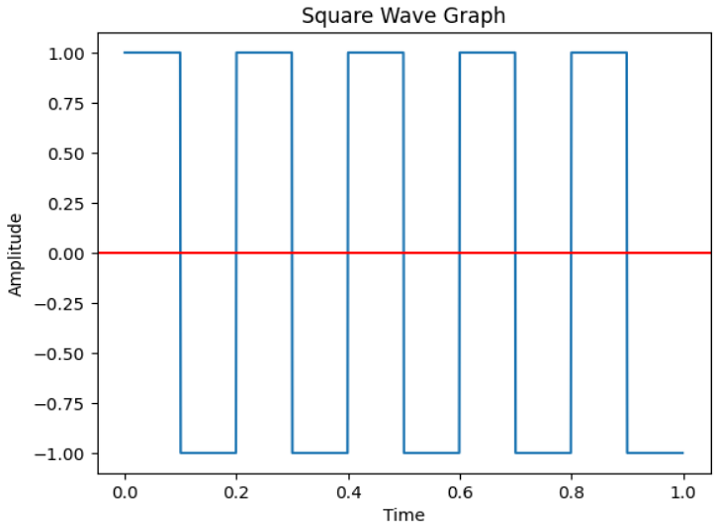
在這個示例中,我們將演示如何繪製一個帶有水平線的方波圖,該水平線指示波的中點。為此,我們將修改上一個示例中的程式碼,新增一行程式碼,在其中我們將使用 axhline() 方法。此方法在圖形的指定點繪製一條水平線。
import numpy as np
import matplotlib.pyplot as plt
from scipy import signal
# Setting frequency and amplitude for square wave
frequency = 5
amplitude = 1
# To generate values from 0 to 1 with a step size of 0.001
axisX = np.arange(0, 1, 0.001)
# Generating square wave signal using frequency and amplitude
period = 1.0 / frequency
axisY = amplitude * signal.square(2 * np.pi * frequency * axisX)
# Plotting the square wave with title and labels
plt.plot(axisX, axisY)
plt.xlabel('Time')
plt.ylabel('Amplitude')
plt.title('Square Wave Graph')
plt.axhline(y = 0, color = 'r')
# to display the final graph
plt.show()
輸出
示例3
在下面的示例中,我們將繪製帶有網格和指示圖形中點的水平線的方波。這裡,x 軸值將由“axis”提供,y 軸值將透過呼叫“signal.square”生成。
import numpy as np
import matplotlib.pyplot as plt
from scipy import signal
# To generate values from 0 to 1
axis = np.arange(0, 1, 0.001)
# Plotting the square wave with title and labels
plt.plot(axis, signal.square(2 * np.pi * 5 * axis))
plt.xlabel('Time')
plt.ylabel('Amplitude')
plt.title('Square Wave Graph')
plt.axhline(y = 0, color = 'r')
plt.grid(True)
# to display the final graph
plt.show()
輸出

結論
在本文中,我們使用 Matplotlib、NumPy 和 SciPy 庫繪製了三種不同的方波圖。我們使用 NumPy 生成隨機資料點,使用 Matplotlib 繪製圖形,使用 SciPy 建立方波形。

1K+ 瀏覽量
