
 資料結構
資料結構 網路
網路 關係型資料庫管理系統
 作業系統
作業系統 Java
Java iOS
iOS HTML
HTML CSS
CSS Android
 Python
 C 程式設計
 C++
C++ C#
C# MongoDB
 MySQL
MySQL Javascript
 PHP
PHP使用 Python 中的 gmplot 包繪製 Google 地圖?
您可以透過多種方法在 Google 地圖上繪製地理座標。但是,如果您想將其儲存到本地檔案,一種更好的方法是透過一個名為 gmplot 的 Python 模組。
Python 庫 gmplot 允許我們在 Google 地圖上繪製資料。gmplot 具有類似 matplotlib 的介面,可以生成 HTML 和 JavaScript,以便在 Google 地圖之上提供所有附加資料。
安裝
如果 gmplot 尚未安裝,則可以使用 pip 輕鬆安裝 gmplot:
pip install gmplot
執行上述命令後,您可能會看到類似以下的輸出:
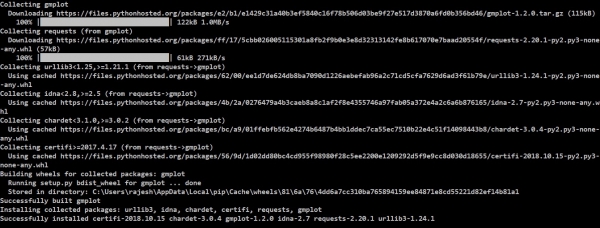
從上面可以看出,最新的 gmplot-1.2.0 版本已安裝到我們的計算機上。
gmplot 庫有幾種繪圖方法可以建立探索性地圖檢視,非常簡單。Gmplot 非常靈活,可以建立 Google 地圖,因為我們可以用它直接生成 html。
以下是實現此目的的不同方法:
案例 1 - 使用 gmplot 建立基本地圖
如果您想將地圖放置到特定位置,則需要編寫該位置的經緯度值和縮放解析度。
# Import gmplot library.
from gmplot import *
# Place map
# First two arugments are the geogrphical coordinates .i.e. Latitude and Longitude
#and the zoom resolution.
gmap = gmplot.GoogleMapPlotter(17.438139, 78.39583, 18)
# Location where you want to save your file.
gmap.draw( "C:\Users\rajesh\Desktop\map11.html" )
輸出 1

注意 - 如果您是透過 API 訪問,由於 Google 地圖服務現在不是免費的,因此您會看到上述螢幕顯示。您需要新增您的 API_KEY 才能看到更好的 Google 地圖檢視。以下程式碼可以實現此目的:
案例 1(添加了 GOOGLE_API_KEY)
使用 gmplot 建立基本地圖
# Import gmplot library.
from gmplot import *
# Place map
# First two arugments are the geogrphical coordinates .i.e. Latitude and Longitude
#and the zoom resolution.
gmap=gmplot.GoogleMapPlotter(17.438139, 78.39583, 18)
# Because google maps is not a free service now, you need to get an api key. Else commenting
# below line you will see the maps with "For Development Purpose Only" on the screen and maps
# with low resolution.
#gmap.apikey = "Your_API_KEY"
gmap.apikey = "AIzaSyDeRNMnZ__VnQDiATiuz4kPjF_c9r1kWe8"
# Location where you want to save your file.
gmap.draw( "C:\Users\rajesh\Desktop\map11.html" )
注意 - 您需要新增 Google 地圖 API 金鑰('Your_API_KEY')並將其設定為等於 gmap.apikey。以下輸出是因為我使用了自己的金鑰,您也可以從以下連結獲取:
https://developers.google.com/maps/documentation/embed/get-api-key
輸出 1

案例 2 - 在 Google 地圖上繪製多邊形
# import gmplot package
import gmplot
latitude_list = [ 17.4567417, 17.5587901, 17.6245545]
longitude_list = [ 78.2913637, 78.007699, 77.9266135 ]
gmap = gmplot.GoogleMapPlotter(17.438139, 78.3936413, 11)
gmap.scatter( latitude_list, longitude_list, '# FF0000', size = 40, marker = False)
# polygon method Draw a polygon with
# the help of coordinates
gmap.polygon(latitude_list, longitude_list, color = 'cornflowerblue')
gmap.apikey = "Your_API_KEY"
gmap.draw( "C:\Users\rajesh\Desktop\map3.html" )
輸出 2

案例 3 - 在 Google 地圖上散點並繪製給定座標之間的線。
# import gmplot package
import gmplot
#Set different latitude and longitude points
Charminar_top_attraction_lats, Charminar_top_attraction_lons = zip(*[
   (17.3833, 78.4011),(17.4239, 78.4738),(17.3713, 78.4804),(17.3616, 78.4747),
   (17.3578, 78.4717),(17.3604, 78.4736),(17.2543, 78.6808),(17.4062, 78.4691),
   (17.3950, 78.3968),(17.3587, 78.2988),(17.4156, 78.4750)])
#declare the center of the map, and how much we want the map zoomed in
gmap3 = gmplot.GoogleMapPlotter(17.3616, 78.4747, 13)
# Scatter map
gmap3.scatter( Charminar_top_attraction_lats, Charminar_top_attraction_lons, '#FF0000',size = 50, marker = False )
# Plot method Draw a line in between given coordinates
gmap3.plot(Charminar_top_attraction_lats, Charminar_top_attraction_lons, 'cornflowerblue', edge_width = 3.0)
#Your Google_API_Key
gmap.apikey = " API_Key”
# save it to html
gmap3.draw(r"c:\users\rajesh\desktop\maps\scatter.html")
輸出 3

案例 4:在一個圖表中使用熱圖和散點來表示地震。
#Import important libraries
import gmplot
import numpy as np
# generate 700 random lats and lons
latitude = (np.random.random_sample(size = 700) - 0.5) * 180
longitude = (np.random.random_sample(size = 700) - 0.5) * 360
# declare the center of the map, and how much we want the map zoomed in
gmap = gmplot.GoogleMapPlotter(0, 0, 2)
# plot heatmap
gmap.heatmap(latitude, longitude)
gmap.scatter(latitude, longitude, c='r', marker=True)
#Your Google_API_Key
gmap.apikey = " Your_Google_API_Key "
# save it to html
gmap.draw(r"c:\users\rajesh\desktop\maps\country_heatmap.html")
輸出


更新於: 2020年6月30日
3K+ 瀏覽量

廣告