
 資料結構
資料結構 網路化
網路化 RDBMS
RDBMS 作業系統
作業系統 Java
Java iOS
iOS HTML
HTML CSS
CSS Android
 Python
 C 程式設計
 C++
C++ C#
C# MongoDB
 MySQL
MySQL Javascript
 PHP
PHP使用 Python plotly 進行地理製圖
Python 提供各種庫來處理地理和圖形資料。Python plotly 是用於繪製地理圖形的庫之一。Plotly 是一個免費開源庫。Plotly 有助於繪製各種型別的圖形,如折線圖、水平條形圖、條形圖、儀表板、散點圖、氣泡圖、餅圖等。
# Import important python geographical libraries.
import plotly.plotly as py
import plotly.graph_objs as go
import pandas as pd
# Must enable in order to use plotly off-line.
from plotly.offline import download_plotlyjs, init_notebook_mode, iplot, plot
# To establish connection
init_notebook_mode()
# type defined is choropleth to
# plot geographical plots
data = dict(type = 'choropleth',
# location: LosAngles, NewJersey, Texas
locations = ['AK', 'AS', 'AZ', 'AR', 'CA', 'CO', 'CT', 'DE', 'DC', 'FM', 'FL', 'GA', 'GU', 'HI', 'ID', 'IL','IN','IA', 'KS', 'KY'],
# States of USA
locationmode = 'USA-states',
# colorscale can be added as per requirement
colorscale = 'Portland',
# text can be given anything you like
text = ['state 1', 'state 2', 'state 3', 'state 4', 'state 5','state 6', 'state 7', 'state 8', 'state 9', 'state 10','state 11', 'state 12', 'state 13', 'state 14', 'state 15','state 16', 'state 17', 'state 18', 'state 19', 'state 20'],
z = [1.0, 2.0, 3.0, 4.0, 5.0, 6.0, 7.0, 8.0, 9.0, 10.0, 11.0, 12.0, 13.0, 14.0, 15.0, 16.0, 17.0, 18.0, 19.0, 20.0],
colorbar = {'title': 'USA-states'})
layout = dict(geo ={'scope': 'usa'})
# passing data dictionary as a list
choromap = go.Figure(data = [data], layout = layout)
# plotting graph
iplot(choromap)
輸出
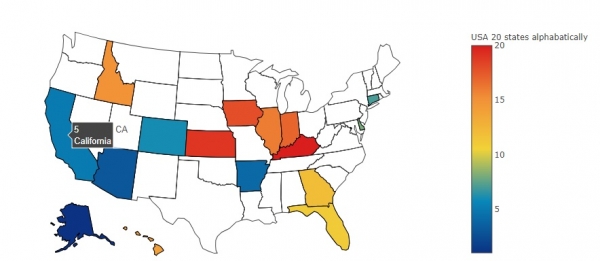
藉助該繪圖功能,我們可以根據想要實現的目的,以不同的方式對資料(輸入項)進行視覺化。我們可以將印度不同邦(29 個)視覺化為不同顏色,具體取決於哪一個政黨執政或取決於食物選擇(素食/非素食),各個邦偏愛哪種食物或任何其他你想看的。Plotly 提供了一個非常強大且互動式的庫,可以用一種易於理解的方式(圖形)對資料進行視覺化。

更新於:2019 年 7 月 30 日
324 次瀏覽

廣告