
 資料結構
資料結構 網路
網路 關係資料庫管理系統 (RDBMS)
 作業系統
作業系統 Java
Java iOS
iOS HTML
HTML CSS
CSS Android
 Python
 C語言程式設計
 C++
C++ C#
C# MongoDB
 MySQL
MySQL Javascript
 PHP
PHP使用pygmaps包在谷歌地圖上繪製資料?
Python pygmaps庫為谷歌地圖javascript api提供了一個包裝器。使用這個庫,Python使用者可以建立一個類似matplotlib的介面來生成html和javascript,然後可以描繪使用者想要新增到谷歌地圖頂部的所有附加資訊。
所需庫
我們只使用pygmaps庫/包。您可以使用pip安裝pygmaps庫,例如:
$pip install pygmaps (windows os)
$sudo pip3 install pygmaps (linux os)
我們將編寫一個程式來顯示:
透過提供經度、緯度和縮放級別來使用pygmaps建立地圖。
透過為網格提供起始和結束經度和緯度點以及網格大小來在地圖上設定網格。
在地圖上新增一個點並透過設定顏色來顯示它。
在地圖上繪製一個以米為半徑的點周圍的圓。
透過提供經度和緯度點的列表來在地圖上繪製路徑。
以下是透過pygmaps獲取不同功能的實現。
import pygmaps
########## CONSTRUCTOR: pygmaps.maps(latitude, longitude, zoom) ##############################
# DESC:initialize a map with latitude and longitude of center point
#and map zoom level "15"
# PARAMETER1:latitude (float) latittude of map center point
# PARAMETER2:longitude (float) latittude of map center point
# PARAMETER3:zoom (int) map zoom level 0~20
# RETURN:the instant of pygmaps
#========================================================================================
mymap = pygmaps.pygmaps(17.45,78.29, 15)


########## FUNCTION: setgrids(start-Lat, end-Lat, Lat-interval, start-Lng, end-Lng, Lng-interval) ######
# DESC:set grids on map
# PARAMETER1:start-Lat (float), start (minimum) latittude of the grids
# PARAMETER2:end-Lat (float), end (maximum) latittude of the grids
# PARAMETER3:Lat-interval (float) grid size in latitude
# PARAMETER4:start-Lng (float), start (minimum) longitude of the grids
# PARAMETER5:end-Lng (float), end (maximum) longitude of the grids
# PARAMETER6:Lng-interval (float) grid size in longitude
# RETURN:no returns
#========================================================================================
mymap.setgrids(17.45, 17.46, 0.001, 78.29,78.30, 0.001)

########## FUNCTION: addpoint(latitude, longitude, [color])#############################
# DESC:add a point into a map and dispaly it, color is optional default is red
# PARAMETER1:latitude (float) latitude of the point
# PARAMETER2:longitude (float) longitude of the point
# PARAMETER3:color (string) color of the point showed in map, using HTML color code
#HTML COLOR CODE: http://www.computerhope.com/htmcolor.htm
#e.g. red "#FF0000", Blue "#0000FF", Green "#00FF00"
# RETURN:no return
#========================================================================================
mymap.addpoint(17.45,78.29, "#FF0000","Hello")


########## FUNCTION: addradpoint(latitude, longitude, radius, [color])##################
# DESC: add a point with a radius (Meter) - Draw cycle
# PARAMETER1:latitude (float) latitude of the point
# PARAMETER2:longitude (float) longitude of the point
# PARAMETER3:radius (float), radius in meter
# PARAMETER4:color (string) color of the point showed in map, using HTML color code
#HTML COLOR CODE: http://www.computerhope.com/htmcolor.htm
#e.g. red "#FF0000", Blue "#0000FF", Green "#00FF00"
# RETURN:no return
#========================================================================================
mymap.addradpoint(17.45,78.29, 150, "#0000FF")


########## FUNCTION: addpath(path,[color])##############################################
# DESC:add a path into map, the data struceture of Path is a list of points
# PARAMETER1:path (list of coordinates) e.g. [(lat1,lng1),(lat2,lng2),...]
# PARAMETER2:color (string) color of the point showed in map, using HTML color code
#HTML COLOR CODE: http://www.computerhope.com/htmcolor.htm
#e.g. red "#FF0000", Blue "#0000FF", Green "#00FF00"
# RETURN:no return
#========================================================================================
path = [(17.45,78.29),
(17.55, 78.39),
(17.65,78.49),
]
mymap.addpath(path,"#00FF00")

########## FUNCTION: draw(file)######################################################
# DESC:create the html map file (.html)
# PARAMETER1:file (string) the map path and file
# RETURN:no return, generate html file in specified directory
#========================================================================================
mymap.draw('./mymap.html')

print('OK')
注意:執行mymap.addpoint函式時,您可能會遇到TypeError錯誤,例如:
TypeError: addpoint() takes from 3 to 4 positional arguments but 5 were given
為了避免這種情況,我在pygmaps.py包的addpoint函式中添加了標題引數。
輸出
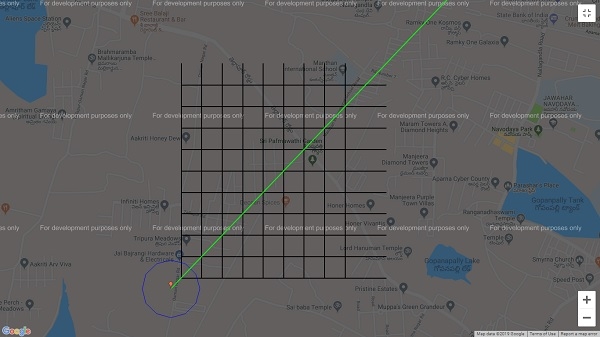
從上面的地圖可以看出,我們能夠在一個地圖中視覺化多個功能。

更新於:2019年7月30日
361 次檢視

廣告