
 資料結構
資料結構 網路
網路 關係資料庫管理系統
 作業系統
作業系統 Java
Java iOS
iOS HTML
HTML CSS
CSS Android
 Python
 C 程式設計
 C++
C++ C#
C# MongoDB
 MySQL
MySQL Javascript
 PHP
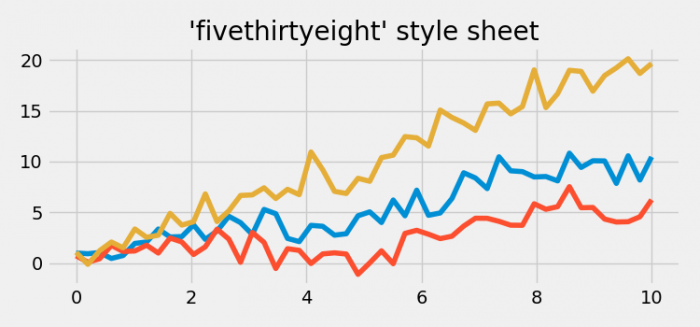
PHP在 Matplotlib 中使用 fivethirtyeight 樣式表繪製曲線
若要使用 **fivethirtyeight** 樣式表,我們可以按照以下步驟操作 −
- 設定圖形大小並調整子圖之間的和周圍的填充。
- 若要使用 **fivethirtyeight**,我們可以使用 **plt.style.use()** 方法。
- 使用 Numpy 建立 **x** 資料點。
- 使用 **subplots()** 方法建立圖形和一組子圖。
- 使用 **plot()** 方法繪製三條曲線。
- 設定圖形的標題。
- 若要顯示圖形,請使用 **show()** 方法。
例證
import matplotlib.pyplot as plt
import numpy as np

plt.rcParams["figure.figsize"] = [7.50, 3.50]
plt.rcParams["figure.autolayout"] = True
plt.style.use('fivethirtyeight')

x = np.linspace(0, 10)
fig, ax = plt.subplots()

ax.plot(x, np.sin(x) + x + np.random.randn(50))
ax.plot(x, np.sin(x) + 0.5 * x + np.random.randn(50))
ax.plot(x, np.sin(x) + 2 * x + np.random.randn(50))
ax.set_title("'fivethirtyeight' style sheet")

plt.show()
輸出

更新於: 09-Jun-2021
414 次瀏覽

廣告