
 資料結構
資料結構 網路
網路 RDBMS
RDBMS 作業系統
作業系統 Java
Java iOS
iOS HTML
HTML CSS
CSS Android
 Python
 C 程式設計
 C++
C++ C#
C# MongoDB
 MySQL
MySQL Javascript
 PHP
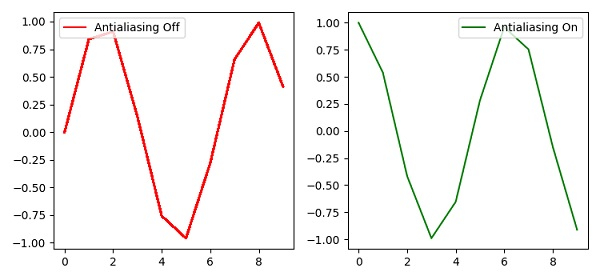
PHP繪製曲線以區分 Matplotlib 中的反鋸齒
為了透過曲線區分反鋸齒,我們可以執行以下步驟 -
使用subplot()方法向當前數字新增子圖,其中nrows=1、ncols=2 和index=1。
使用plot() 方法繪製曲線,其中反鋸齒標記為 false 且顏色為紅色。
使用legend()方法將圖例放置在左上角。
使用 subplot() 方法向當前數字新增子圖,其中 nrows=1、ncols=2 和 index=2。
使用 plot()方法繪製曲線,其中反鋸齒標記為 true 且顏色為綠色。
使用legend()方法將圖例放置在右上角。
要顯示圖片,請使用show() 方法。
範例
import numpy as np
from matplotlib import pyplot as plt
plt.rcParams["figure.figsize"] = [7.50, 3.50]
plt.rcParams["figure.autolayout"] = True
plt.subplot(1, 2, 1)
plt.plot(range(10), np.sin(range(10)), antialiased=False, label='Antialiasing Off', c="red")
plt.legend(loc="upper left")
plt.subplot(1, 2, 2)
plt.plot(range(10), np.cos(range(10)), antialiased=True, label='Antialiasing On', c="green")
plt.legend(loc="upper right")
plt.show()
輸出

更新於:2021 年 4 月 10 日
205 次瀏覽

廣告