
 資料結構
資料結構 網路
網路 RDBMS
RDBMS 作業系統
作業系統 Java
Java iOS
iOS HTML
HTML CSS
CSS Android
 Python
 C 程式設計
 C++
C++ C#
C# MongoDB
 MySQL
MySQL Javascript
 PHP
PHPMatplotlib 對數刻度刻度標籤數字格式
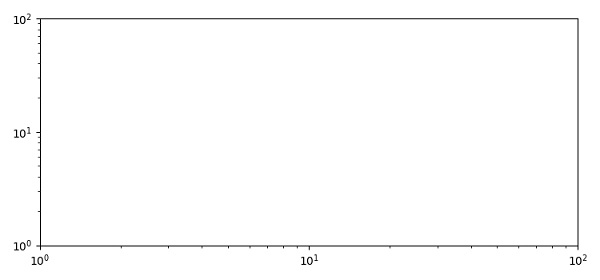
要在軸上設定對數刻度刻度標籤數字,我們可以執行以下步驟 -
在 x 和 y 軸上使用 ylim 和 xlim 設定 x 和 y 軸限制(1 到 100)。
使用 loglog() 方法,在 x 和 y 軸上進行對數刻度繪圖。
使用 plot() 方法顯示圖形。
示例
from matplotlib import pyplot as plt
plt.rcParams["figure.figsize"] = [7.50, 3.50]
plt.rcParams["figure.autolayout"] = True
plt.ylim(1, 100)
plt.xlim(1, 100)
plt.loglog()
plt.show()
輸出

更新日期:09-4 月-2021
522 次瀏覽

廣告