
 資料結構
資料結構 網路
網路 RDBMS
RDBMS 作業系統
作業系統 Java
Java iOS
iOS HTML
HTML CSS
CSS Android
 Python
 C 程式設計
 C++
C++ C#
C# MongoDB
 MySQL
MySQL Javascript
 PHP
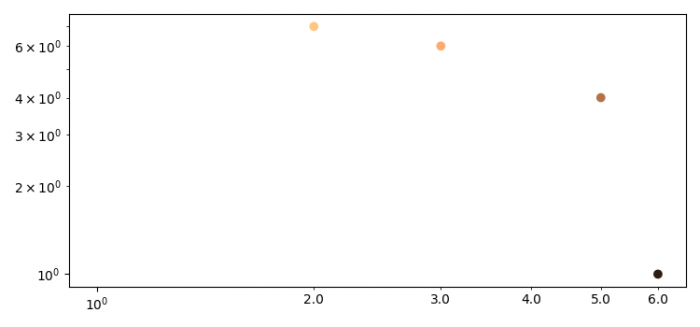
PHP如何去除 Matplotlib 對數-對數繪圖中的科學標號?
若要從 matplotlib 對數-對數繪圖中去除科學標號,我們可以使用 ax.xaxis.set_minor_formatter(mticker.ScalarFormatter()) 語句。
步驟
- 設定影像的大小並調整子圖之間以及周圍的內邊距。
- 使用 numpy 建立 x 和 y 資料點。
- 使用 scatter() 方法繪製 x 和 y 資料點。
- 使用 set_xscale() 和 set_yscale() 方法設定 x 和 y 軸比例。
- 若要去除科學標號,請將刻度值格式化為一個數字。
- 若要顯示影像,請使用 show() 方法。
示例
import numpy as np
from matplotlib import pyplot as plt, ticker as mticker

plt.rcParams["figure.figsize"] = [7.50, 3.50]
plt.rcParams["figure.autolayout"] = True

x = np.array([1, 7, 6, 4, 0])
y = np.array([6, 2, 3, 5, 1])

plt.scatter(y, x, c=x, cmap="copper")

ax = plt.gca()
ax.set_xscale('log')
ax.set_yscale('log')
ax.xaxis.set_minor_formatter(mticker.ScalarFormatter())

plt.show()
輸出

更新時間:2021 年 6 月 3 日
4K+ 次瀏覽

廣告