
 資料結構
資料結構 網路
網路 RDBMS
RDBMS 作業系統
作業系統 Java
Java iOS
iOS HTML
HTML CSS
CSS Android
 Python
 C 程式設計
 C++
C++ C#
C# MongoDB
 MySQL
MySQL JavaScript
 PHP
PHP如何在 Matplotlib 中停用對數繪圖的次刻度?
要停用 matplotlib 中對數繪圖的次刻度,我們可以使用 minorticks_off() 方法。
步驟
- 設定圖形大小並調整子圖之間和周圍的填充。
- 使用 numpy 建立 x 和 y 資料點。
- 在當前圖形中新增子圖,索引為 1。
- 使用 color=red 繪製 x 和 y 資料點。
- 按名稱將 x 刻度設定為日誌類。
- 設定當前繪圖的標題。
- 在當前圖形中新增子圖,索引為 2。
- 使用 color=green 繪製 xy 資料點。
- 按名稱將 x 刻度設定為日誌類。
- 關閉繪圖的次刻度。
- 將繪圖的標題設為索引 2。
- 要顯示圖形,請使用 show() 方法。
示例
import numpy as np
from matplotlib import pyplot as plt
plt.rcParams["figure.figsize"] = [7.50, 3.50]
plt.rcParams["figure.autolayout"] = True
x = np.random.randint(-3, 3, 10)
y = np.exp(x)
plt.subplot(121)
plt.plot(y, x, c='red')
plt.xscale('log')
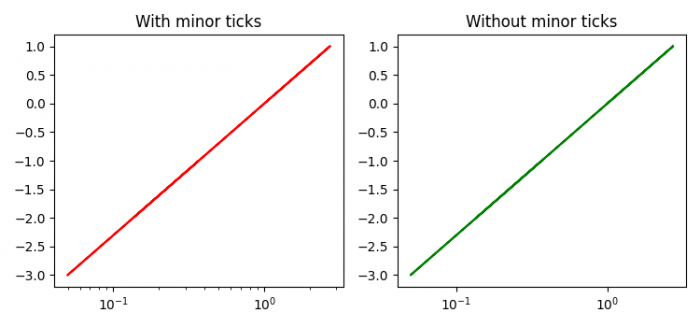
plt.title("With minor ticks")
plt.subplot(122)
plt.plot(y, x, c='green')
plt.xscale('log')
plt.minorticks_off()
plt.title("Without minor ticks")
plt.show()輸出

更新於: 2021-06-01
3 千 + 瀏覽量

廣告