
 資料結構
資料結構 網路
網路 關係資料庫管理系統 (RDBMS)
 作業系統
作業系統 Java
Java iOS
iOS HTML
HTML CSS
CSS Android
 Python
 C 程式設計
 C++
C++ C#
C# MongoDB
 MySQL
MySQL Javascript
 PHP
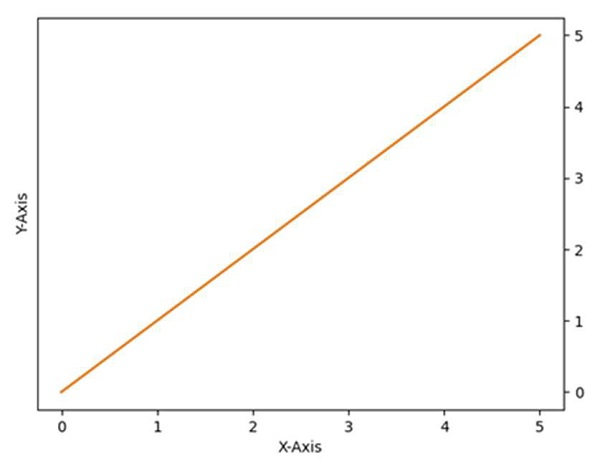
PHP如何在 matplotlib 中將 Y 軸刻度從圖表的左側移動到右側?
要將 Y 軸刻度從左側移到右側,我們可以執行以下步驟:
使用 figure() 方法建立一個圖形。
使用上述 figure 方法,使用 add_subplot(xyz) 建立繪圖的座標軸,其中 x 是行,y 是列,z 是索引。
要將 Y 軸刻度從左側移動到右側,請使用 ax.yaxis.tick_right(),其中 ax 是使用 add_subplot(xyz) 方法建立的座標軸。
現在使用 plot() 方法繪製線條,使用給定的 x 和 y 點,其中 x 和 y 點可以使用 np.array() 方法建立。
設定 x 和 y 標籤,例如 X 軸和 Y 軸,使用 xlabel 和 ylabel 方法。
使用 plt.show() 顯示圖形。
示例
from matplotlib import pyplot as plt
import numpy as np

f = plt.figure()
ax = f.add_subplot(111)
ax.yaxis.tick_right()
xpoints = np.array([0, 5])
ypoints = np.array([0, 5])
plt.plot(xpoints, ypoints)

plt.ylabel("Y-axis ")
plt.xlabel("X-axis ")

plt.show()
輸出

更新於:2021年3月15日
6000+ 瀏覽量

廣告