
 資料結構
資料結構 網路
網路 RDBMS
RDBMS 作業系統
作業系統 Java
Java iOS
iOS HTML
HTML CSS
CSS Android
 Python
 C 程式設計
 C++
C++ C#
C# MongoDB
 MySQL
MySQL Javascript
 PHP
PHP在 Matplotlib 圖形的軸上顯示小數位數和科學計數法
為了在 matplotlib 的軸上顯示小數位數和科學記數法,我們可以使用標量格式化器,透過替換_set_format() 方法。
步驟
使用 numpy 建立 x 和 y 資料點。
使用 plot() 方法繪製 x 和 y。
使用 gca() 方法,獲取當前軸。
將格式刻度值例項化為數字類,即ScalarFormatter。
使用 set_powerlimits((0, 0)) 方法,設定科學記數法的尺寸閾值。
使用set_major_formatter() 方法,設定主要標記的格式。
要顯示圖形,使用show() 方法。
示例
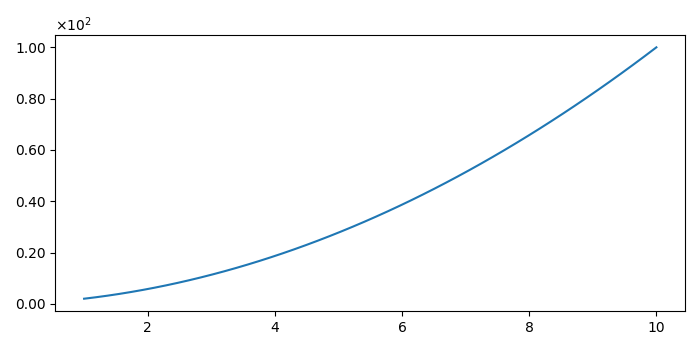
import numpy as np
from matplotlib.ticker import ScalarFormatter
from matplotlib import pyplot as plt
plt.rcParams["figure.figsize"] = [7.00, 3.50]
plt.rcParams["figure.autolayout"] = True

class ScalarFormatterClass(ScalarFormatter):
   def _set_format(self):
      self.format = "%1.2f"

x = np.linspace(1, 10)
y = np.linspace(2,10)
y = x * y
plt.plot(x, y)
ax = plt.gca()
yScalarFormatter = ScalarFormatterClass(useMathText=True)
yScalarFormatter.set_powerlimits((0,0))
ax.yaxis.set_major_formatter(yScalarFormatter)
plt.show()
結果

更新於:08-05-2021
6K+ 瀏覽量

廣告