
 資料結構
資料結構 網路
網路 RDBMS
RDBMS 作業系統
作業系統 Java
Java iOS
iOS HTML
HTML CSS
CSS Android
 Python
 C 程式設計
 C++
C++ C#
C# MongoDB
 MySQL
MySQL Javascript
 PHP
PHP如何在不移動 Matplotlib 中相應的刻度的情況下,移動刻度標籤?
若要在 Matplotlib 中移動刻度標籤而不移動相應的刻度,可以使用 axvline() 方法並相應地對其進行批註。
步驟
- 設定圖形大小並調整子圖之間以及子圖周圍的填充。
- 初始化變數 delta。
- 使用 numpy 建立 x 和 y 資料點。
- 使用 axvline() 方法繪製 delta。
- 使用 annotate() 方法對該直線進行批註。
- 使用 plot() 方法繪製 x 和 y 資料點。
- 要顯示圖形,請使用 show() 方法。
示例
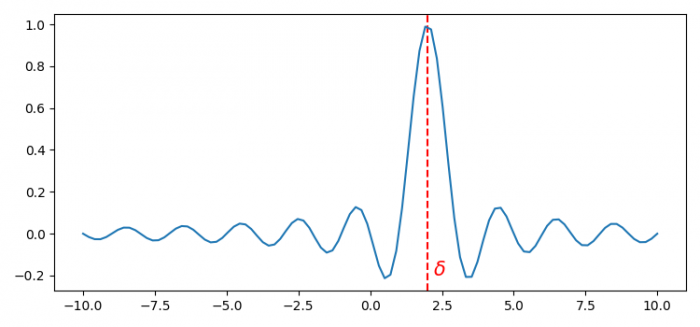
from matplotlib import pyplot as plt
import numpy as np

plt.rcParams["figure.figsize"] = [7.50, 3.50]
plt.rcParams["figure.autolayout"] = True

delta = 2.0
x = np.linspace(-10, 10, 100)
y = np.sinc(x - delta)

plt.axvline(delta, ls="--", color="r")
plt.annotate(r"$\delta$", xy=(delta + 0.2, -0.2), color="r", size=15)
plt.plot(x, y)

plt.show()
輸出

更新於: 2021-6-15
已瀏覽 501 次

廣告