
 資料結構
資料結構 網路
網路 關係型資料庫管理系統
 作業系統
作業系統 Java
Java iOS
iOS HTML
HTML CSS
CSS Android
 Python
 C 程式設計
 C++
C++ C#
C# MongoDB
 MySQL
MySQL JavaScript
 PHP
PHP使用 LaTeX 渲染時,我如何更改 Matplotlib 繪圖中的座標軸刻度字型?
使用 LaTeX 渲染時,若要更改 matplotlib 中的座標軸刻度字型,我們可以採取以下步驟:
使用 numpy 建立 x 和 y 資料點。
使用 subplot() 方法,將子圖新增到當前圖形中。
使用 set_xticks 和 set_yticks 方法分別使用資料點 x 和 y 設定 x 和 y 刻度。
使用 plot() 方法並設定 color=red 繪製 x 和 y。
若要設定粗體字重,我們可以使用 LaTeX 表示法。
若要顯示圖形,請使用 show() 方法。
示例
import numpy as np
import matplotlib.pyplot as plt
plt.rcParams["figure.figsize"] = [7.00, 3.50]
plt.rcParams["figure.autolayout"] = True
x = np.array([1, 2, 3, 4])
y = np.exp(x)
ax1 = plt.subplot()
ax1.set_xticks(x)
ax1.set_yticks(y)
ax1.plot(x, y, c="red")
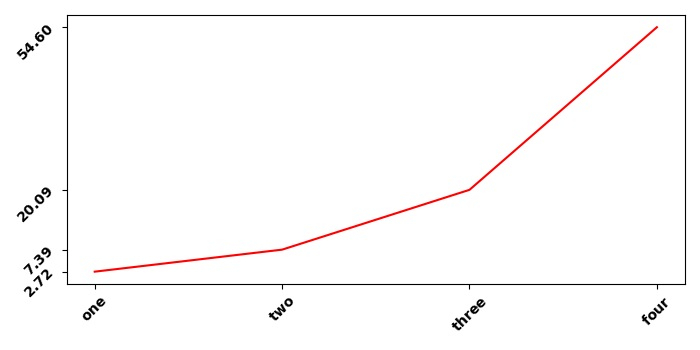
ax1.set_xticklabels(["$\bf{one}$", "$\bf{two}$", "$\bf{three}$", "$\bf{four}$"], rotation=45)
ax1.set_yticklabels(["$\bf{:.2f}$".format(y[0]), "$\bf{:.2f}$".format(y[1]),
"$\bf{:.2f}$".format(y[2]), "$\bf{:.2f}$".format(y[3])], rotation=45)
plt.tight_layout()
plt.show()輸出

更新日期: 15-5-2021
467 瀏覽

廣告