
 資料結構
資料結構 網路
網路 RDBMS
RDBMS 作業系統
作業系統 Java
Java iOS
iOS HTML
HTML CSS
CSS Android
 Python
 C 程式設計
 C++
C++ C#
C# MongoDB
 MySQL
MySQL Javascript
 PHP
PHP如何在 Matplotlib 中將標題放在圖表的底部?
要將行標題放在 Matplotlib 圖表的底部,我們可以執行以下步驟 -
設定圖表大小和調整子圖之間和周圍的填充。
初始化變數 N,以獲取示例資料的數量。
使用 scatter() 方法繪製 x 和 y 資料點。
使用 y=-0.01 將標題設定在 matplotlib 圖的底部。
使用 show() 方法顯示圖表。
示例
import numpy as np
from matplotlib import pyplot as plt
plt.rcParams["figure.figsize"] = [7.50, 3.50]
plt.rcParams["figure.autolayout"] = True
N = 100
x = np.random.rand(N)
y = np.random.rand(N)
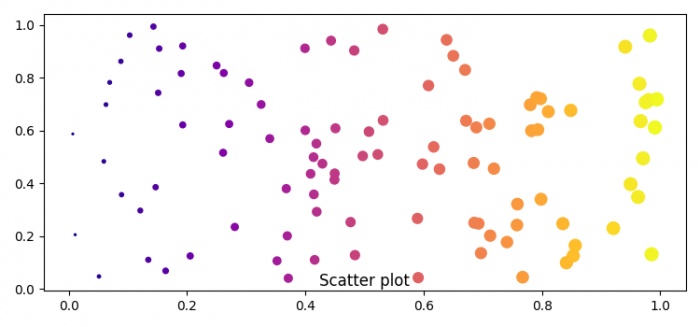
plt.scatter(x, y, c=x, s=x*100+1, cmap="plasma")
plt.title('Scatter plot', y=-0.01)
plt.show()輸出

更新於: 2021-09-23
6K+ 檢視

廣告