
 資料結構
資料結構 網路
網路 RDBMS
RDBMS 作業系統
作業系統 Java
Java iOS
iOS HTML
HTML CSS
CSS Android
 Python
 C 程式設計
 C++
C++ C#
C# MongoDB
 MySQL
MySQL Javascript
 PHP
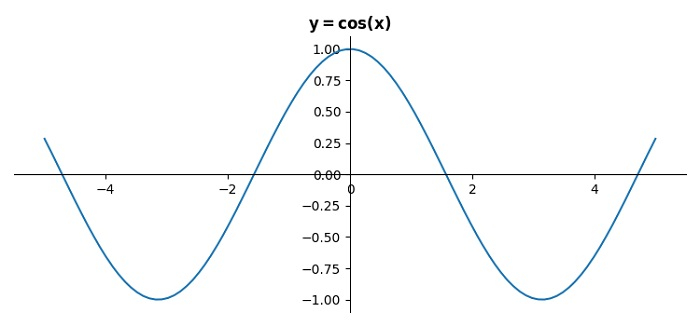
PHP如何在 Python Matplotlib 中將原點放在餘弦曲線圖的中心?
若想將 Cos 曲線圖的原點放在圖表的中心,我們可以採取以下步驟 -
設定圖片大小、以及子圖之間的間距。
使用 numpy 建立 x、y 資料點。
使用 spines, top, left, right 和 bottom 設定座標軸位置。
使用 plot() 方法繪製 x、y 資料點。
設定曲線的標題。
使用 show() 方法顯示曲線。
示例
import numpy as np
from matplotlib import pyplot as plt
plt.rcParams["figure.figsize"] = [7.50, 3.50]
plt.rcParams["figure.autolayout"] = True

x = np.linspace(-5, 5, 100)
y = np.cos(x)

ax = plt.gca()
ax.spines['top'].set_color('none')
ax.spines['left'].set_position('zero')
ax.spines['right'].set_color('none')
ax.spines['bottom'].set_position('zero')

plt.plot(x, y)
plt.title("$\bf{y=cos(x)}$")

plt.show()
輸出

更新於: 04-06-2021
1000+ 次瀏覽

廣告