
 資料結構
資料結構 網路
網路 RDBMS
RDBMS 作業系統
作業系統 Java
Java iOS
iOS HTML
HTML CSS
CSS Android
 Python
 C 程式設計
 C++
C++ C#
C# MongoDB
 MySQL
MySQL Javascript
 PHP
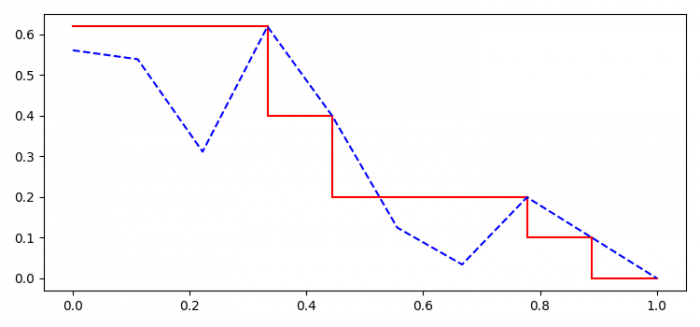
PHP如何在 Python Matplotlib 中藉助插值來繪製定精度召回曲線?
要在 Python 中藉助插值繪製定精度召回曲線,我們可以執行以下步驟:
步驟
設定圖形大小並調整子圖之間和周圍的填充。
使用 numpy 建立 r、p 和重複的召回,即資料點。
建立一個圖形和一組子圖。
繪製取值範圍在 r.shape 中的召回矩陣。
使用 plot() 方法繪製 r 和 dup_r 資料點。
要顯示圖形,請使用 show() 方法。
示例
import numpy as np
import matplotlib.pyplot as plt

plt.rcParams["figure.figsize"] = [7.50, 3.50]
plt.rcParams["figure.autolayout"] = True

r = np.linspace(0.0, 1.0, num=10)
p = np.random.rand(10) * (1. - r)
dup_p = p.copy()
i = r.shape[0] - 2

while i >= 0:
   if p[i + 1] > p[i]:
      p[i] = p[i + 1]
   i = i - 1

fig, ax = plt.subplots()

for i in range(r.shape[0] - 1):
   ax.plot((r[i], r[i]), (p[i], p[i + 1]), 'k-', label='', color='red')
   ax.plot((r[i], r[i + 1]), (p[i + 1], p[i + 1]), 'k-', label='', color='red')

ax.plot(r, dup_p, 'k--', color='blue')
plt.show()
輸出
它將生成以下輸出:

更新於:2022 年 2 月 2 日
782 人瀏覽

廣告