
 資料結構
資料結構 網路
網路 RDBMS
RDBMS 作業系統
作業系統 Java
Java iOS
iOS HTML
HTML CSS
CSS Android
 Python
 C 程式設計
 C++
C++ C#
C# MongoDB
 MySQL
MySQL Javascript
 PHP
PHP如何在 Matplotlib 中向曲線新增游標?
若要在 Matplotlib 中向曲線新增游標,我們可以採取以下步驟 −
- 設定圖形大小並調整子圖之間以及子圖周圍的填充。
- 使用 numpy 建立 t 和 s 資料點。
- 建立一個圖形和一組子圖。
- 獲取游標類例項,以更新繪圖中的游標點。
- 在 mouse_event 中,得到滑鼠當前位置的 x 和 y 資料。
- 獲得 x 和 y 資料點的索引號。
- 設定 x 和 y 座標。
- 設定文字座標並重新繪製 agg 緩衝器和滑鼠事件。
- 使用 plot() 方法繪製 t 和 s 資料點。
- 設定一些軸屬性。
- 使用 show() 方法顯示圖形。
範例
import matplotlib.pyplot as plt
import numpy as np
plt.rcParams["figure.figsize"] = [7.50, 3.50]
plt.rcParams["figure.autolayout"] = True
class CursorClass(object):
def __init__(self, ax, x, y):
self.ax = ax
self.ly = ax.axvline(color='yellow', alpha=0.5)
self.marker, = ax.plot([0], [0], marker="o", color="red", zorder=3)
self.x = x
self.y = y
self.txt = ax.text(0.7, 0.9, '')
def mouse_event(self, event):
if event.inaxes:
x, y = event.xdata, event.ydata
indx = np.searchsorted(self.x, [x])[0]
x = self.x[indx]
y = self.y[indx]
self.ly.set_xdata(x)
self.marker.set_data([x], [y])
self.txt.set_text('x=%1.2f, y=%1.2f' % (x, y))
self.txt.set_position((x, y))
self.ax.figure.canvas.draw_idle()
else:
return
t = np.arange(0.0, 1.0, 0.01)
s = np.sin(2 * 2 * np.pi * t)
fig, ax = plt.subplots()
cursor = CursorClass(ax, t, s)
cid = plt.connect('motion_notify_event', cursor.mouse_event)
ax.plot(t, s, lw=2, color='green')
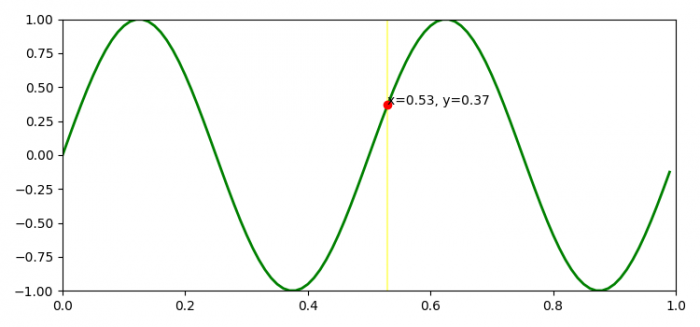
plt.axis([0, 1, -1, 1])
plt.show()輸出


更新於: 04-Aug-2021
2K+ 瀏覽量

廣告