
 資料結構
資料結構 網路
網路 RDBMS
RDBMS 作業系統
作業系統 Java
Java iOS
iOS HTML
HTML CSS
CSS Android
 Python
 C 程式設計
 C++
C++ C#
C# MongoDB
 MySQL
MySQL Javascript
 PHP
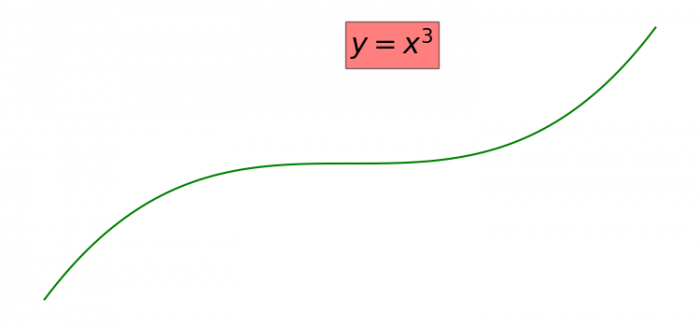
PHP如何在 Matplotlib 中在繪圖內新增文字?
要在 Matplotlib 中在繪圖內新增文字,我們可以採取以下步驟 −
- 設定圖形大小並調整子圖之間的和周圍的填充。
- 使用 numpy 建立x和y資料點。
- 放置具有某些文字屬性的文字。
- 使用plot()方法繪製x和y。
- 關閉座標軸。
- 要顯示圖形,請使用show()方法。
示例
import numpy as np
from matplotlib import pyplot as plt

plt.rcParams["figure.figsize"] = [7.50, 3.50]
plt.rcParams["figure.autolayout"] = True

x = np.linspace(-5, 5, 100)
y = x ** 3

plt.text(0, 100, '$y=x^3$', fontsize=22, bbox=dict(facecolor='red', alpha=0.5))
plt.plot(x, y, c='g')
plt.axis('off')

plt.show()
輸出

更新於: 03-Jun-2021
9K+ 次瀏覽

廣告