
 資料結構
資料結構 網路
網路 RDBMS
RDBMS 作業系統
作業系統 Java
Java iOS
iOS HTML
HTML CSS
CSS Android
 Python
 C 程式設計
 C++
C++ C#
C# MongoDB
 MySQL
MySQL Javascript
 PHP
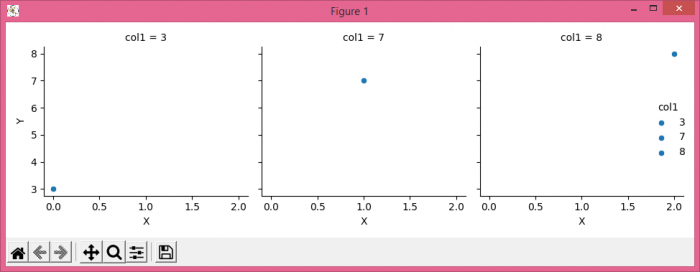
PHP如何在使用 matplotlib 的 Seaborn facetgrid 條形圖中新增圖例?
步驟
- 設定圖形大小,並調整子圖之間和周圍的空白。
- 使用 col1 列建立一個數據框。
- 用於繪製條件關係的多圖網格。
- 使用 map_dataframe()。此方法適合使用接受長結構 DataFrame 作為 'data' 關鍵字引數並使用字串變數名訪問該 DataFrame 中資料的功能繪圖。
- 為 plot() 新增一個圖例。
- 要顯示圖形,請使用 show() 方法。
示例
import pandas as pd
import seaborn as sns
from matplotlib import pyplot as plt

plt.rcParams["figure.figsize"] = [7.50, 3.50]
plt.rcParams["figure.autolayout"] = True

df = pd.DataFrame({'col1': [3, 7, 8]})

g = sns.FacetGrid(df, col="col1", hue="col1")
g.map_dataframe(sns.scatterplot)
g.set_axis_labels("X", "Y")
g.add_legend()

plt.show()
輸出

更新於:17-Jun-2021
4K+ 次觀看

廣告