
 資料結構
資料結構 網路
網路 RDBMS
RDBMS 作業系統
作業系統 Java
Java iOS
iOS HTML
HTML CSS
CSS Android
 Python
 C 程式設計
 C++
C++ C#
C# MongoDB
 MySQL
MySQL Javascript
 PHP
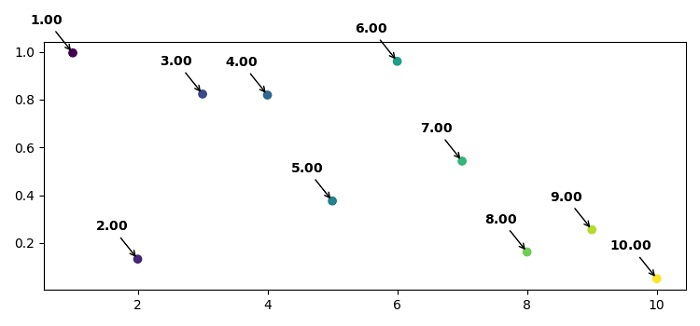
PHP如何在 Matplotlib 中新增加粗註釋文字?
要新增加粗註釋文字,我們可以在 matplotlib 中使用 LaTeX 表示法作為標記。
步驟
設定圖形大小並調整子圖之間和周圍的填充。
使用 numpy 建立x和y資料點。
要設定每個分散點的標籤,請列出標籤。
使用scatter()方法繪製xpoints、ypoints。對於顏色,請使用 xpoints。
迭代拉鍊化的標籤、xpoints和ypoints。
在 for 迴圈中使用帶加粗 LaTeX 表示法的annotate()方法。
要顯示圖形,請使用show()方法。
示例
import numpy as np
from matplotlib import pyplot as plt
plt.rcParams["figure.figsize"] = [7.50, 3.50]
plt.rcParams["figure.autolayout"] = True
xpoints = np.linspace(1, 10, 10)
ypoints = np.random.rand(10)
labels = ["%.2f" % i for i in xpoints]
plt.scatter(xpoints, ypoints, c=xpoints)
for label, x, y in zip(labels, xpoints, ypoints):
   plt.annotate(
      f"$\bf{label}$",
      xy=(x, y), xytext=(-20, 20),
      textcoords='offset points', ha='center', va='bottom',
      arrowprops=dict(arrowstyle='->', connectionstyle='arc3,rad=0'))
plt.show()
輸出

更新於: 03-06-2021
1K+ 瀏覽

廣告