
 資料結構
資料結構 網路
網路 RDBMS
RDBMS 作業系統
作業系統 Java
Java iOS
iOS HTML
HTML CSS
CSS Android
 Python
 C 程式設計
 C++
C++ C#
C# MongoDB
 MySQL
MySQL Javascript
 PHP
PHP如何移除 Matplotlib 圖表底部的空白區域?
要移除 Matplotlib 圖表底部的空白區域,我們可以使用**tight layout** 或**autoscale_on=False**。
步驟
設定圖形大小,並調整子圖之間的填充。
建立一個新的圖形或啟用一個現有的圖形。
將一個**'ax'**新增到圖中,作為一個子圖的組成部分。
使用**plot()**方法繪製一個數據點列表。
要顯示圖形,請使用**show()**方法。
示例
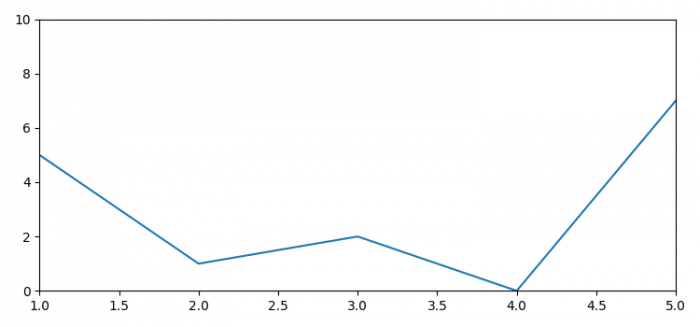
from matplotlib import pyplot as plt

plt.rcParams["figure.figsize"] = [7.50, 3.50]
plt.rcParams["figure.autolayout"] = True

fig = plt.figure()

ax = fig.add_subplot(111, autoscale_on=False, xlim=(1, 5), ylim=(0, 10))
ax.plot([2, 5, 1, 2, 0, 7])

plt.show()
輸出

更新於: 23-Sep-2021
3K+ 次瀏覽

廣告