
 資料結構
資料結構 網路
網路 RDBMS
RDBMS 作業系統
作業系統 Java
Java iOS
iOS HTML
HTML CSS
CSS Android
 Python
 C 程式設計
 C++
C++ C#
C# MongoDB
 MySQL
MySQL Javascript
 PHP
PHP如何使用 R 中的 ggplot2 繪製從原點開始的迴歸線?
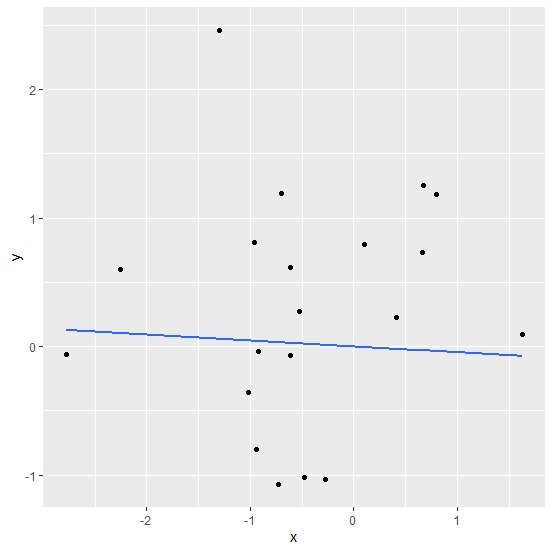
從原點開始的迴歸線意味著從迴歸模型中刪除了模型的截距。要繪製從原點開始的迴歸線,我們可以在 ggplot2 包的 geom_smooth 函式中使用公式減去 1。
考慮下面的資料框 −
示例
x<-rnorm(20)
y<-rnorm(20)
df<-data.frame(x,y)
df
輸出
       x        y
1    0.7936844   1.18542740
2   -0.6143234  -0.06681784
3   -0.5260676   0.26993531
4   -0.9181893  -0.03549873
5   -0.2728913  -1.03655161
6   -0.7030962   1.18929567
7   -0.6145780   0.61194367
8   -2.7765935  -0.06167213
9   -2.2535913   0.59793773
10  -0.7330266  -1.07433426
11   0.6723913   1.25331326
12   1.6307157   0.09585268
13  -0.4791150  -1.01449433
14  -0.9577056   0.80677202
15   0.1023982   0.79843355
16  -1.0203498  -0.35537811
17  -0.9433246  -0.80303154
18   0.6654104   0.73242246
19  -1.2954933   2.46313259
20   0.4077880   0.23019373
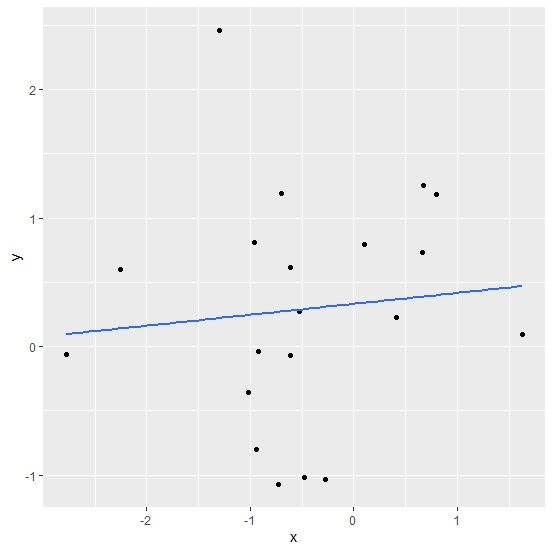
載入 ggplot2 包並針對 x 和 y 之間的線性迴歸模型建立一個迴歸線 −
示例
library(ggplot2) ggplot(df,aes(x,y))+geom_point()+geom_smooth(method=lm,se=FALSE)
`geom_smooth()` using formula 'y ~ x'
輸出
針對 x 和 y 之間的線性迴歸模型建立從原點開始的迴歸線 −
示例
ggplot(df,aes(x,y))+geom_point()+geom_smooth(method=lm,se=FALSE,formula=y~x-1)
輸出

更新於: 2021 年 2 月 6 日
925 次瀏覽

廣告