
 資料結構
資料結構 網路
網路 RDBMS
RDBMS 作業系統
作業系統 Java
Java iOS
iOS HTML
HTML CSS
CSS Android
 Python
 C 程式設計
 C++
C++ C#
C# MongoDB
 MySQL
MySQL Javascript
 PHP
PHP如何在 R 中使用 ggplot2 更改繪圖區域邊距?
使用 ggplot2 建立繪圖時,繪圖區域為正方形,但我們可以透過在主題函式中設定 plot.margin 來更改繪圖區域。當我們想要減少繪圖區域以及資料點較少的情況時,這很有幫助。
示例
考慮以下資料框 −
> set.seed(1)
> x<-rnorm(20,0.2)
> y<-rnorm(20,0.5)
> df<-data.frame(x,y)
載入 ggplot2 包 −
> library(ggplot2)
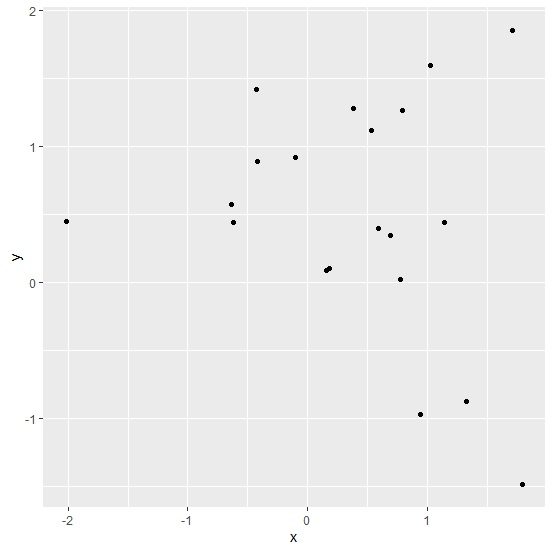
不更改繪圖區域邊距建立散點圖 −
> ggplot(df,aes(x,y))+
+ geom_point()
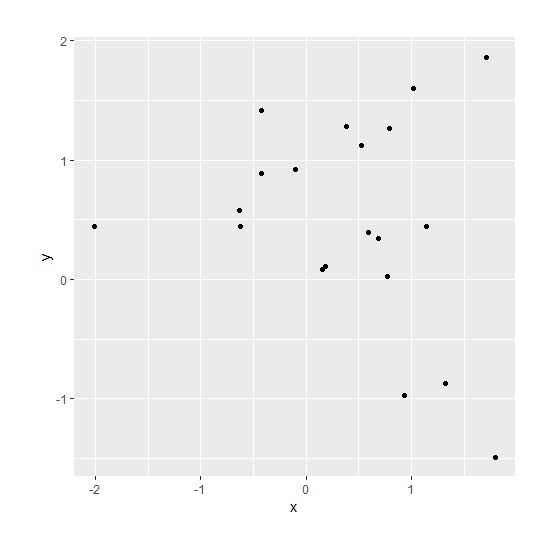
> ggplot(df,aes(x,y))+
+ geom_point()+
+ theme(plot.margin = unit(c(1,1,1,1), "cm"))
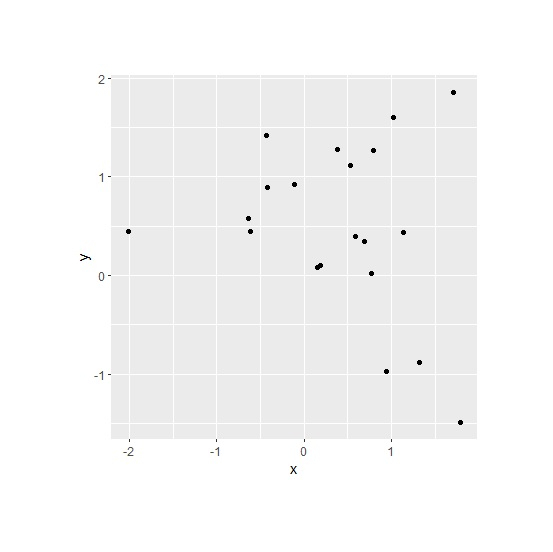
> ggplot(df,aes(x,y))+
+ geom_point()+
+ theme(plot.margin = unit(c(2,2,2,2), "cm"))

更新時間: 11-Aug-2020
1K+ 檢視

廣告