
 資料結構
資料結構 網路
網路 RDBMS
RDBMS 作業系統
作業系統 Java
Java iOS
iOS HTML
HTML CSS
CSS Android
 Python
 C 程式設計
 C++
C++ C#
C# MongoDB
 MySQL
MySQL Javascript
 PHP
PHP如何使用 ggplot2 在 R 中建立具有圖例位置位於繪圖區域內的散點圖?
圖例有助於我們在建立散點圖時區分響應變數的值。藉助這種方式,我們可以瞭解一個因子變數級別如何影響響應變數。圖例通常位於左下角、右上角、左上角和右下角。我們可以使用 theme 函式來設定圖例的位置。
示例
考慮下方資料框 −
> set.seed(99)
> x1<-rnorm(20)
> x2<-rnorm(20,2)
> F<-factor(c("A","B","C","D"))
> df<-data.frame(x1,x2,F)
> library(ggplot2)
使用不同的圖例位置建立繪圖 −
考慮下方資料框 −
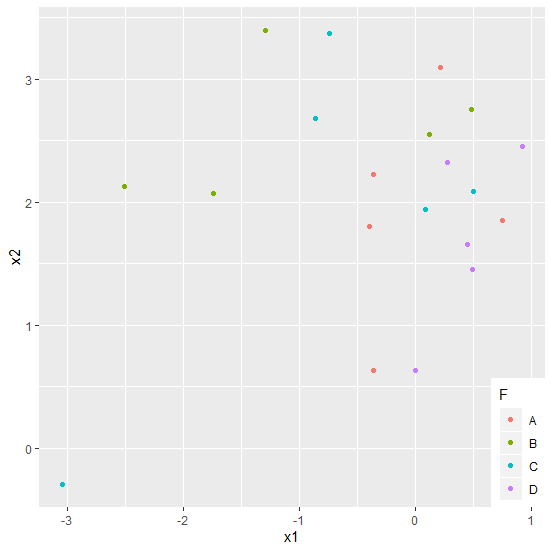
> ggplot(df, aes(x=x1, y=x2, colour=F)) + geom_point(aes(colour=F)) +
+ theme(legend.justification = c(1, 0), legend.position = c(1, 0))
輸出
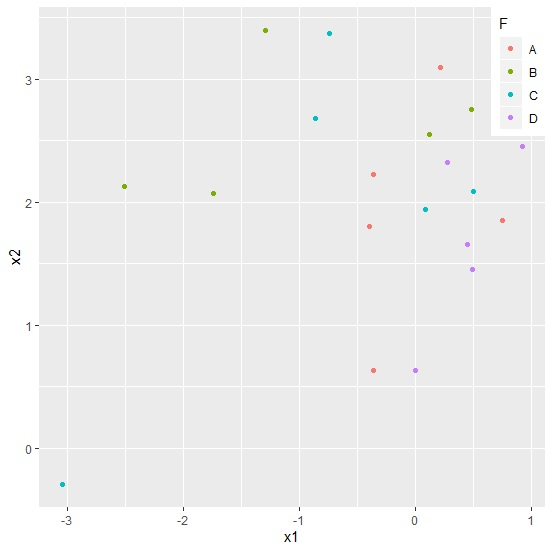
> ggplot(df, aes(x=x1, y=x2, colour=F)) + geom_point(aes(colour=F)) +
+ theme(legend.justification = c(1, 1), legend.position = c(1, 1))
輸出
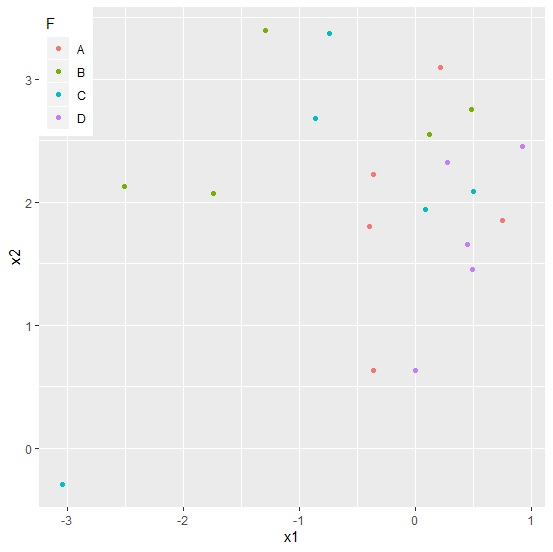
> ggplot(df, aes(x=x1, y=x2, colour=F)) + geom_point(aes(colour=F)) +
+ theme(legend.justification = c(0, 1), legend.position = c(0, 1))
輸出
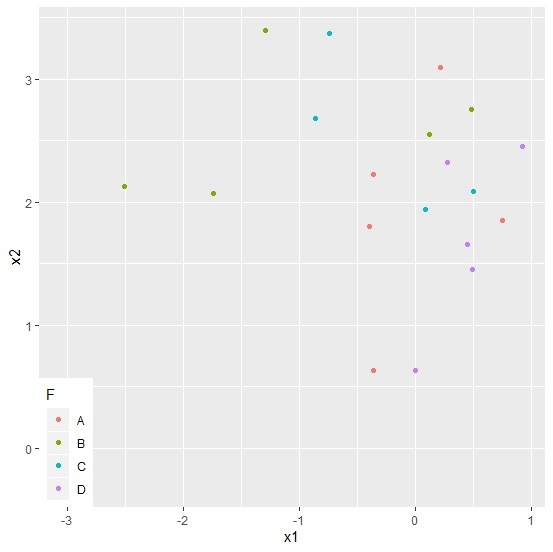
> ggplot(df, aes(x=x1, y=x2, colour=F)) + geom_point(aes(colour=F)) +
+ theme(legend.justification = c(0, 0), legend.position = c(0, 0))
輸出

更新日期:2020-08-12
242 次瀏覽

廣告