
 資料結構
資料結構 網路
網路 RDBMS
RDBMS 作業系統
作業系統 Java
Java iOS
iOS HTML
HTML CSS
CSS Android
 Python
 C 程式設計
 C++
C++ C#
C# MongoDB
 MySQL
MySQL Javascript
 PHP
PHP如何使用 R 中的 ggplot2 建立點圖?
點圖是一種柱狀圖,用點代替條形,專為小型資料集建立。在 ggplot2 中,我們有 geom_dotplot 函式來建立點圖,但我們必須傳遞 geom_dotplot的引數 binwidth 的正確值,這樣我們才不會收到警告資訊“警告:忽略未知引數: bins `stat_bindot()` 使用 `bins = 30`。透過 `binwidth` 選擇更好的值。”
示例
考慮以下資料框 −
> x<-rnorm(100)
> df1<-data.frame(x)
載入 ggplot2 包 −
> library(ggplot2)
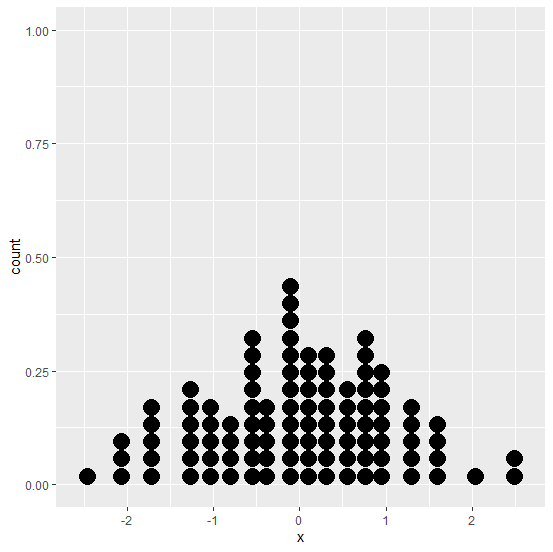
建立 x 的點圖 −
> ggplot(df1,aes(x))+geom_dotplot(binwidth=0.2)
輸出
我們再看一個示例 −
> y<-sample(1:10,100,replace=TRUE)
> df2<-data.frame(y)
> ggplot(df2,aes(y))+geom_dotplot(binwidth=0.2)
輸出


更新於: 2020 年 9 月 4 日
440 次瀏覽

廣告