
 資料結構
資料結構 網路
網路 關係型資料庫管理系統
 作業系統
作業系統 Java
Java iOS
iOS HTML
HTML CSS
CSS Android
 Python
 C 程式設計
 C++
C++ C#
C# MongoDB
 MySQL
MySQL Javascript
 PHP
PHP如何在 R 中使用 ggplot2 建立具有兩個圖例的散點圖?
如果我們想要建立一個具有兩個圖例的散點圖,那麼我們必須有兩個分類或因子列。這可以透過以下步驟完成:
- 建立一個具有兩個數值列和兩個分類列的資料框
- 使用 ggplot2 包的 geom_point 函式的 shape 和 color 引數建立散點圖
建立資料框
讓我們建立一個如下所示的資料框:
x<-rnorm(20)
y<-rnorm(20)
Gender<-sample(c("Male","Female"),20,replace=TRUE)
Group<-sample(c("I","II","III"),20,replace=TRUE)
df<-data.frame(x,y,Gender,Group)
df
執行上述指令碼後,將生成以下輸出(由於隨機化,此輸出在您的系統上會有所不同):
        x          y   Gender Group
1 -0.4799690 1.5891955 Female II
2 0.9413427 0.1495437 Male    III
3 0.2321381 1.1012327 Female  I
4 0.9742311 0.7938336 Male    III
5 -0.3035013 0.8117990 Male   I
6 1.2574545 -0.5482740 Female I
7 0.2966496 0.1084953 Female  III
8 0.5882950 0.2693988 Female  III
9 1.2275719 -0.9168983 Female II
10 -0.3383743 0.3960809 Male  II
11 -0.0976704 0.4654153 Female III
12 -0.5239506 0.4893968 Female I
13 1.0714197 0.5457905 Female  II
14 1.5720266 0.6403787 Female  I
15 -0.6347866 0.7467298 Female I
16 0.4176001 0.5003941 Female  I
17 -0.7211758 0.5015195 Female III
18 -0.9957714 -0.2087898 Male  I
19 0.5924078 1.3892832 Male   III
20 -0.7466664 -0.1326818 Male III
建立具有兩個圖例的散點圖
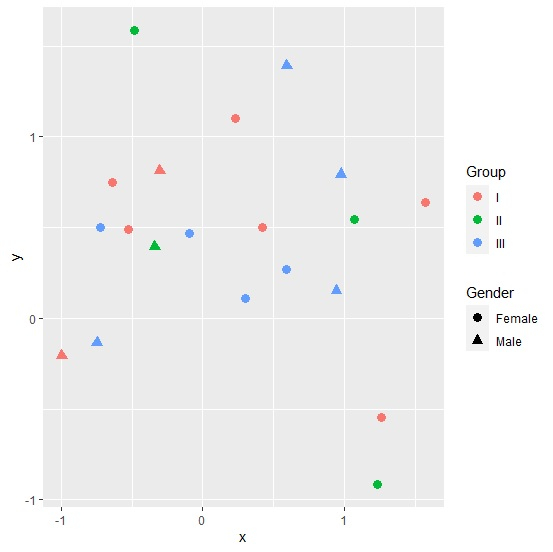
載入 ggplot2 包並建立散點圖,其中形狀由性別定義,顏色由組定義:
library(ggplot2)
x<-rnorm(20)
y<-rnorm(20)
Gender<-sample(c("Male","Female"),20,replace=TRUE)
Group<-sample(c("I","II","III"),20,replace=TRUE)
df<-data.frame(x,y,Gender,Group)
ggplot(df,aes(x,y))+geom_point(aes(shape=Gender,color=Group),size=3)
輸出

更新於:2021年8月13日
1K+ 次檢視

廣告