
 資料結構
資料結構 網路
網路 關係資料庫管理系統 (RDBMS)
 作業系統
作業系統 Java
Java iOS
iOS HTML
HTML CSS
CSS Android
 Python
 C語言程式設計
 C++
C++ C#
C# MongoDB
 MySQL
MySQL Javascript
 PHP
PHP如何在R中使用ggplot2建立散點圖,並根據變數更改點的形狀和顏色?
一般來說,散點圖中點的預設形狀是圓形,但可以使用整數、序列或變數將其更改為其他形狀。我們只需要在`geom_point`函式中使用`shape`引數並傳遞變數名即可。例如,如果我們想建立一個散點圖,其中點的形狀隨變數x而變化,則可以使用`geom_point(shape=x)`。如果想改變大小,可以使用整數值。
示例
考慮以下資料框:
set.seed(151)
x<-rnorm(20,5,1)
y<-rnorm(20,5,2)
df<-data.frame(x,y)
df
輸出
      x       y
1 4.948461 2.255857
2 5.765737 1.726474
3 4.853260 4.280697
4 4.886814 7.402230
5 4.604489 3.708252
6 5.782276 3.978782
7 3.602522 3.801754
8 3.981162 6.091206
9 5.229476 4.017412
10 5.672173 5.383071
11 4.515448 3.882945
12 5.560609 6.845399
13 5.066156 7.307996
14 3.650124 2.255179
15 4.757084 7.580363
16 3.763259 7.309804
17 3.525322 7.891359
18 7.437159 5.522026
19 5.673526 8.858292
20 5.310040 3.800228
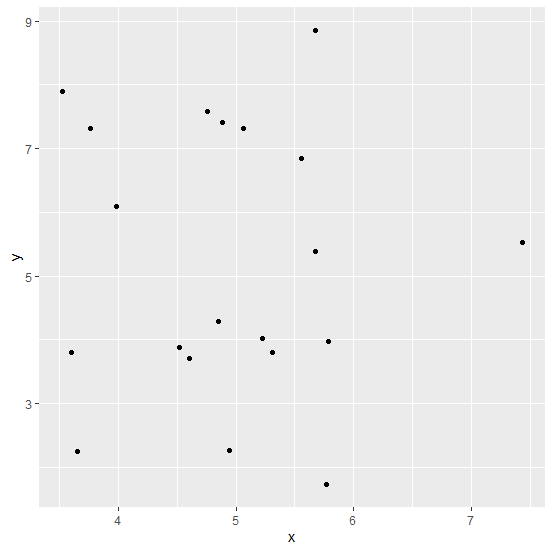
載入ggplot2包並在x和y之間建立點圖:
示例
library(ggplot2)
ggplot(df,aes(x,y))+geom_point()
輸出
建立散點圖,更改點的形狀,大小設定為3:
示例
ggplot(df,aes(x,y))+geom_point(shape=x,color=x,size=3)
輸出


更新於:2020年10月17日
474 次瀏覽

廣告