
 資料結構
資料結構 網路
網路 關係型資料庫管理系統 (RDBMS)
 作業系統
作業系統 Java
Java iOS
iOS HTML
HTML CSS
CSS Android
 Python
 C語言程式設計
 C++
C++ C#
C# MongoDB
 MySQL
MySQL Javascript
 PHP
PHP如何在R的ggplot2中,當散點圖的點基於另一個序列繪製時,增加這些點的大小?
當我們使用ggplot2繪製散點圖,並且點的大小基於一個數值序列時,對於較小的數值,點的大小可能非常小。結果,檢視這些點會比較困難。因此,我們可能需要增加這些點的大小。這可以透過使用`scale_size_continuous`函式來實現,在這個函式中,我們可以設定點的尺寸範圍。
示例
考慮下面的資料框:
x<-rnorm(10,1)
y<-rnorm(10,2)
Pair<-1:10
df<-data.frame(x,y,Pair)
df
輸出
      x       y         Pair
1 0.2722750 0.7855144    1
2 0.6708724 2.8385502    2
3 1.6939261 1.7415868    3
4 0.5773440 2.1596557    4
5 0.1965571 0.7356820    5
6 0.3368027 1.4774414    6
7 0.8248820 2.8211750    7
8 -0.3364834 2.5258274   8
9 -0.3229903 1.1579749   9
10 -1.1594988 1.0636472  10
載入ggplot2包並建立一個散點圖,點的大小基於Pair列:
示例
library(ggplot2)
ggplot(df,aes(x,y,size=Pair))+geom_point()
輸出
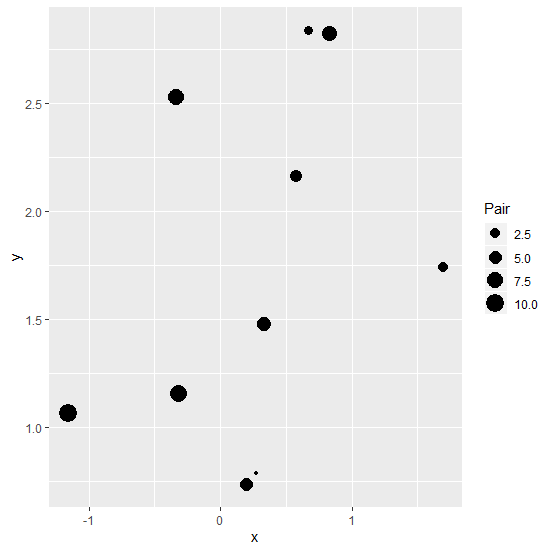
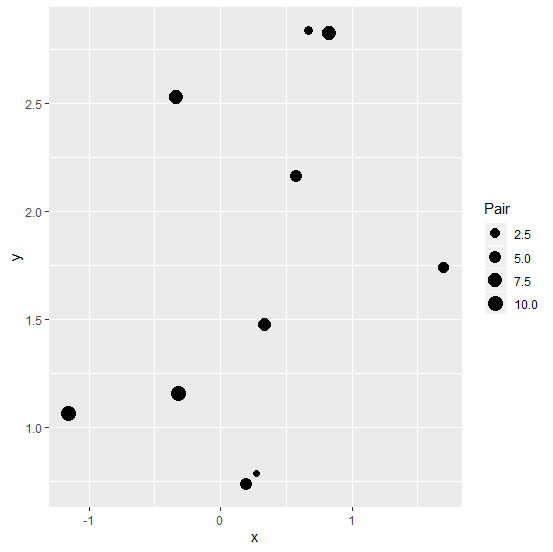
建立一個具有點大小範圍的散點圖:
示例
ggplot(df,aes(x,y,size=Pair))+geom_point()+scale_size_continuous(range = c(2,5))
輸出

更新於:2020年9月8日
500 次瀏覽

廣告