
 資料結構
資料結構 網路
網路 RDBMS
RDBMS 作業系統
作業系統 Java
Java iOS
iOS HTML
HTML CSS
CSS Android
 Python
 C 程式設計
 C++
C++ C#
C# MongoDB
 MySQL
MySQL Javascript
 PHP
PHP如何在 R 中使用繪圖函式用平滑曲線連線散點圖上的點?
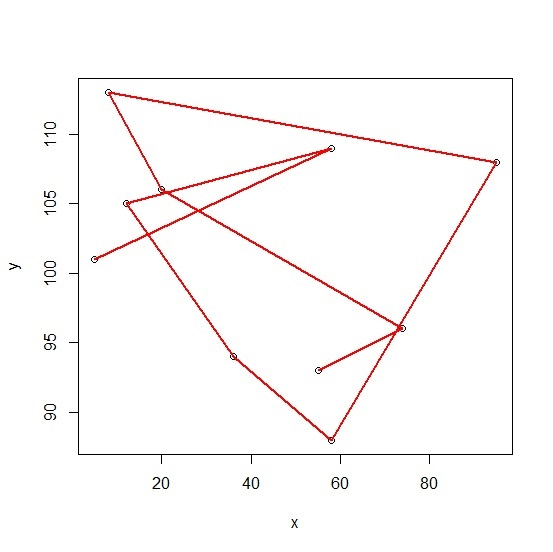
如果散點圖的散點程度很高,用平滑的線條連線點非常困難,但我們可能會想要檢視無法透過只看點就理解的平滑度。瞭解該模型是否為線性模型也很有幫助。我們可以使用 plot 函式透過 loess 繪製模型來實現此目的。
示例
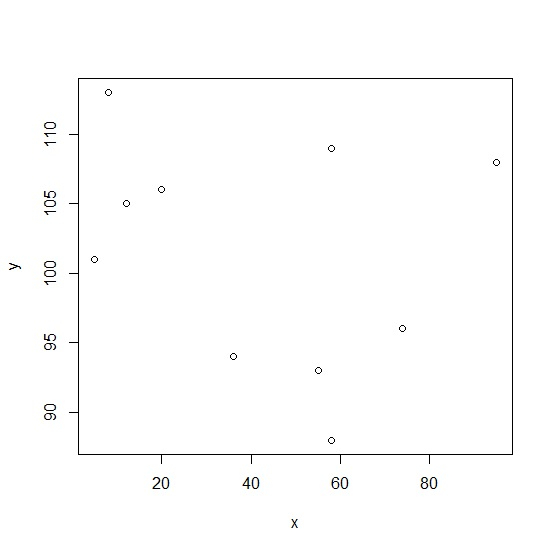
考慮以下資料 -
> set.seed(3)
> x<-sample(1:100,10,replace=TRUE)
> y<-rpois(10,100)
使用 loess 建立平滑線條 -
> Model <- loess(y~x)
> summary(Model)
Call:
loess(formula = y ~ x)
Number of Observations: 10
Equivalent Number of Parameters: 4.77
Residual Standard Error: 8.608
Trace of smoother matrix: 5.27 (exact)
Control settings:
span       : 0.75
degree     : 2
family     : gaussian
surface    : interpolate cell = 0.2
normalize  : TRUE
parametric : FALSE
drop.square: FALSE
> plot(x,y)
輸出
> lines(Model, col='red', lwd=2)
輸出

更新日期:10-8-2020
268 瀏覽

廣告