
 資料結構
資料結構 網路
網路 RDBMS
RDBMS 作業系統
作業系統 Java
Java iOS
iOS HTML
HTML CSS
CSS Android
 Python
 C 程式設計
 C++
C++ C#
C# MongoDB
 MySQL
MySQL Javascript
 PHP
PHP如何在 R 中根據不同形狀的點來繪製情節?
在基礎 R 中,可以使用 plot 函式內部的 pch 引數來建立具有不同形狀點的繪圖。pch 值與形狀的列表如下所寫 -
pch = 0 display square
pch = 1 display circle
pch = 2 display triangle point up
pch = 3 display plus
pch = 4 display cross
pch = 5 display diamond
pch = 6 display triangle point down
pch = 7 display square cross
pch = 8 display star
pch = 9 display diamond plus
pch = 10 display circle plus
pch = 11 display triangles up and down
pch = 12 display square plus
pch = 13 display circle cross
pch = 14 display square and triangle down
pch = 15 display filled square
pch = 16 display filled circle
pch = 17 display filled triangle point-up
pch = 18 display filled diamond
pch = 19 display solid circle
pch = 20 display bullet (smaller circle)
pch = 21 display filled circle blue
pch = 22 display filled square blue
pch = 23 display filled diamond blue
pch = 24 display filled triangle point-up blue
pch = 25 display filled triangle point down blue
示例
考慮以下向量並建立具有三種不同形狀的點圖表 -
x<-sample(0:5,20,replace=TRUE)
y<-sample(1:10,20,replace=TRUE)
plot(x,y,pch=c(16,17,18))
輸出

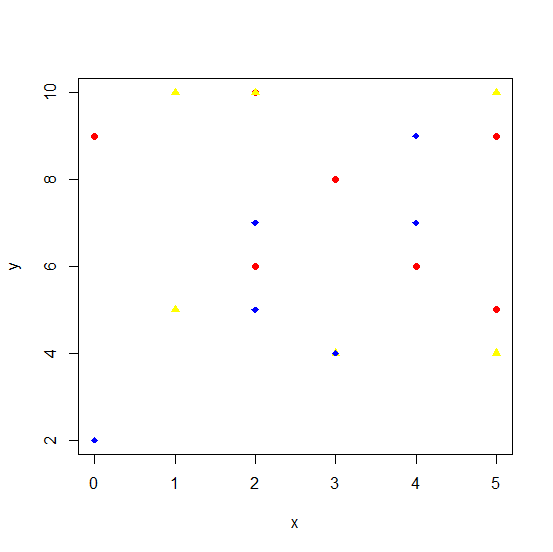
建立具有不同形狀顏色的相同繪圖 -
示例
plot(x,y,pch=c(16,17,18),col=c("red","yellow","blue"))輸出

更新於: 2020 年 10 月 17 日
906 次瀏覽

廣告