
 資料結構
資料結構 網路
網路 關係型資料庫管理系統
 作業系統
作業系統 Java
Java iOS
iOS HTML
HTML CSS
CSS Android
 Python
 C 程式設計
 C++
C++ C#
C# MongoDB
 MySQL
MySQL Javascript
 PHP
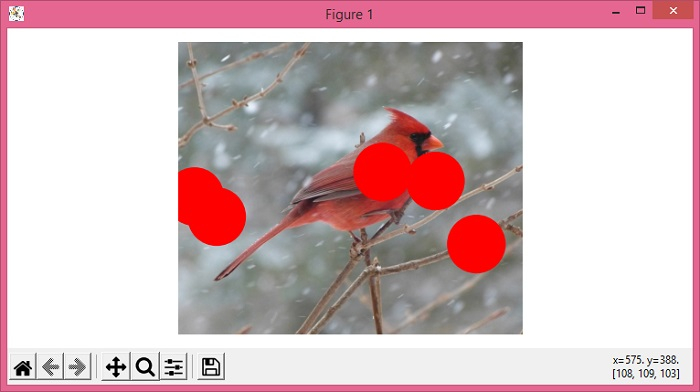
PHP使用 Matplotlib 和 NumPy 在影像上繪製圓
要使用 matplotlib 和 numpy 在影像上繪製圓,我們可以執行以下步驟:
設定圖形大小並調整子圖之間和周圍的填充。
從檔案中讀取影像到一個數組中。
使用 numpy 建立 x 和 y 資料點。
使用 subplots() 方法建立圖形和一組子圖。
以影像形式顯示資料,即在二維規則光柵上使用 imshow() 方法。
關閉座標軸。
在當前座標軸上新增補丁。
要顯示圖形,請使用 show() 方法。
示例
import matplotlib.pyplot as plt
import numpy as np
from matplotlib.patches import Circle

plt.rcParams["figure.figsize"] = [7.50, 3.50]
plt.rcParams["figure.autolayout"] = True

img = plt.imread('bird.jpg')

x = np.random.rand(5) * img.shape[1]
y = np.random.rand(5) * img.shape[0]

fig, ax = plt.subplots(1)
ax.imshow(img)
ax.axis('off')

for xx, yy in zip(x, y):
   circ = Circle((xx, yy), 50, color='red')
   ax.add_patch(circ)

plt.show()
輸出

更新日期:04-6 月-2021
2K+ 檢視次數

廣告