
 資料結構
資料結構 網路
網路 RDBMS
RDBMS 作業系統
作業系統 Java
Java iOS
iOS HTML
HTML CSS
CSS Android
 Python
 C 程式設計
 C++
C++ C#
C# MongoDB
 MySQL
MySQL Javascript
 PHP
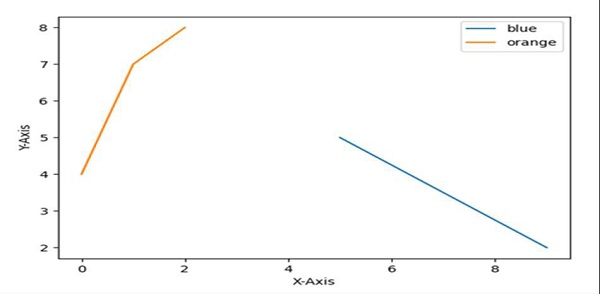
PHP僅顯示圖例中的某些專案 Python Matplotlib
使用 plt.legend(),我們可以透過將值放入列表中來新增或僅顯示某些專案。
步驟
使用 plt.xlabel() 方法設定 X 軸標籤。
使用 plt.ylabel() 方法設定 Y 軸標籤。
使用 plot() 方法引數中傳遞的列表繪製線條。
Location 和 legend_drawn 標誌有助於找到位置,併為邊框設定 True 標誌。
設定帶有“藍色”和“橙色”元素的圖例。
要顯示圖形,請使用 plt.show() 方法。
示例
import matplotlib.pyplot as plt

plt.ylabel("Y-axis ")
plt.xlabel("X-axis ")

plt.plot([9, 5], [2, 5], [4, 7, 8])

location = 0 # For the best location
legend_drawn_flag = True
plt.legend(["blue", "orange"], loc=0, frameon=legend_drawn_flag)

plt.show()
輸出

更新於:2021-03-17
2K+ 次瀏覽

廣告